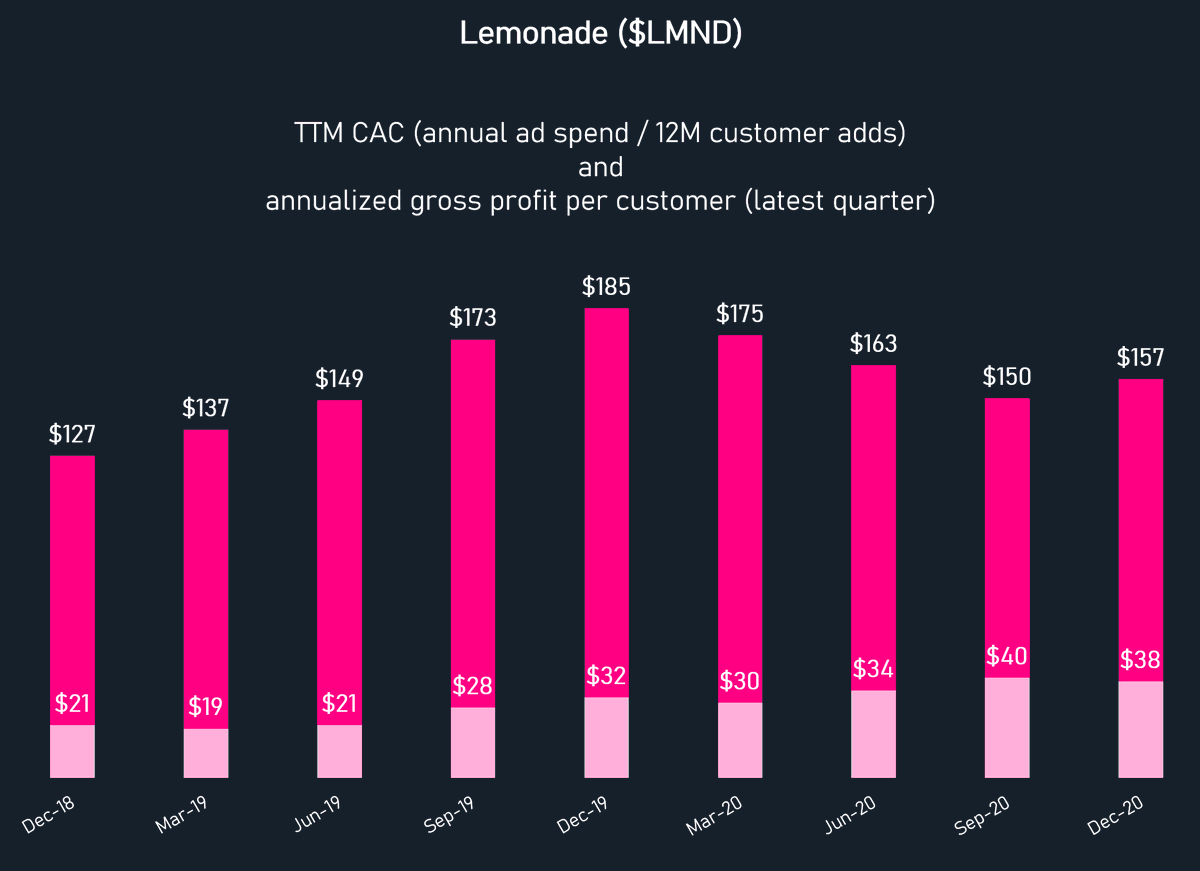
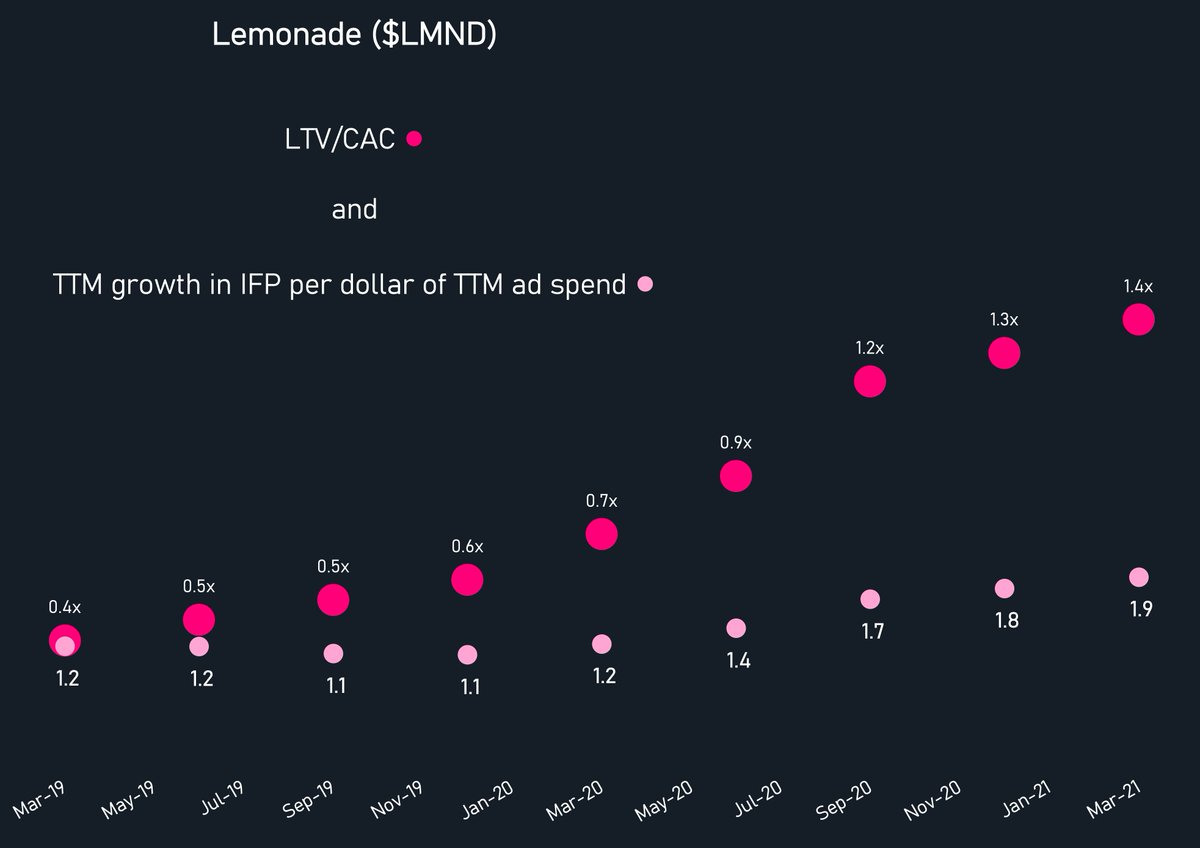
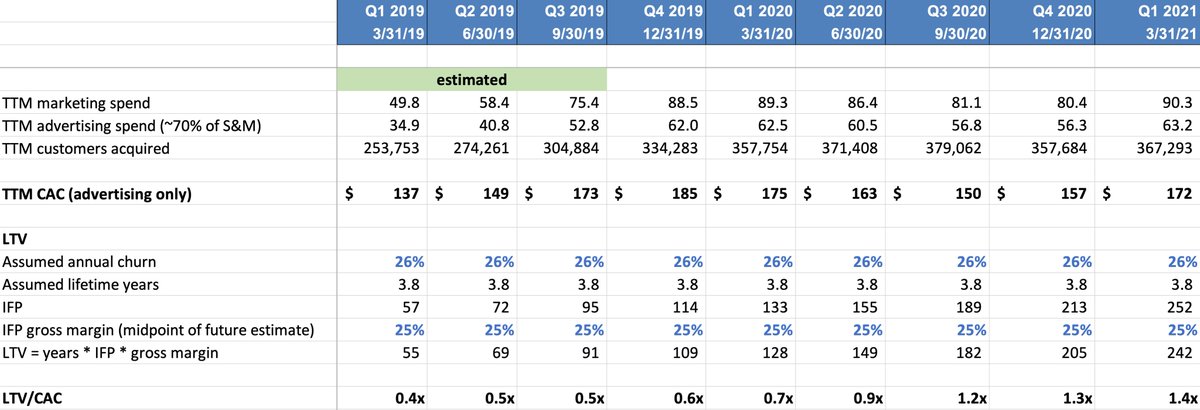
$LMND's LTV/CAC is trending in the right direction. This chart shows 1.4x LTV/CAC in the MRQ. The second series shows the *growth* in IFP over the LTM per dollar of ad spend in the same period (~70% of S&M as a proxy): 
Here are the inputs. The company released annual dollar retention data with earnings. 81% in Q1 2021, of which 7 points were upsells, so let's say 74% retention. That means 26% yearly churn, or an LTV of 3.8 years. Gross margins are about 20% but will see upward pressure...
...from two sources: first, life insurance, which flows thru at 100% since it's not an owned policy, just commission. Second, a reduction in reinsurance over time as the company proves out its underwriting and keeps more of the economics. I'm using 25%. Note that...
...at the time of the IPO the company said this could go as high as 35%.
Long term model: If we assume best-in-class expense ratio of 15% at scale (similar to GEICO) and loss ratio of 70%, that means a combined ratio of 85%, for an operating margin of 15%.
Today: 1.1m customers @ $230 premium per customer
In a decade? We can model this...
Today: 1.1m customers @ $230 premium per customer
In a decade? We can model this...
...out with various growth scenarios. Let's assume we agree on 8.4m customers, $1,147 premium per customer = $9.6 billion of IFP, $1.4 bn of operating income, $1.1 bn of earnings. At 20x plus net cash = $28 bn market cap or ~18% IRR from here.
Disclaimer: do your own work...
Disclaimer: do your own work...
...and don't rely on this as it's not financial advice of any kind. I'm merely sharing this so that folks can poke holes in it.
(But before you post a short report please understand the difference between a security hole and customers sharing their quotes 😉)
(But before you post a short report please understand the difference between a security hole and customers sharing their quotes 😉)
• • •
Missing some Tweet in this thread? You can try to
force a refresh