#Bitcoin update
Reflections on May 19
1/15
The target of my analyses is always aimed at two questions:
1. Are we still in a macro bull cycle
2. If 1 = yes, are we at an intermediate cycle that calls for adding or potentially reducing risk, i.e. are we overbought / oversold.
Reflections on May 19
1/15
The target of my analyses is always aimed at two questions:
1. Are we still in a macro bull cycle
2. If 1 = yes, are we at an intermediate cycle that calls for adding or potentially reducing risk, i.e. are we overbought / oversold.
https://twitter.com/2210ft/status/1394773964514336776
2/15
I believe that we will see further cycles in the market and I rather want to reduce some risk at the end phase of a bull market and put cash aside and add at depressed levels instead of watching the decline and holding through it.
I believe that we will see further cycles in the market and I rather want to reduce some risk at the end phase of a bull market and put cash aside and add at depressed levels instead of watching the decline and holding through it.
3/15
Also, as the crypto space is developing rapidly, you regularly find interesting projects and then Question 2 is relevant because if you buy in a bull market at all you want to buy at an attractive point in terms of R/R.
Also, as the crypto space is developing rapidly, you regularly find interesting projects and then Question 2 is relevant because if you buy in a bull market at all you want to buy at an attractive point in terms of R/R.
4/15
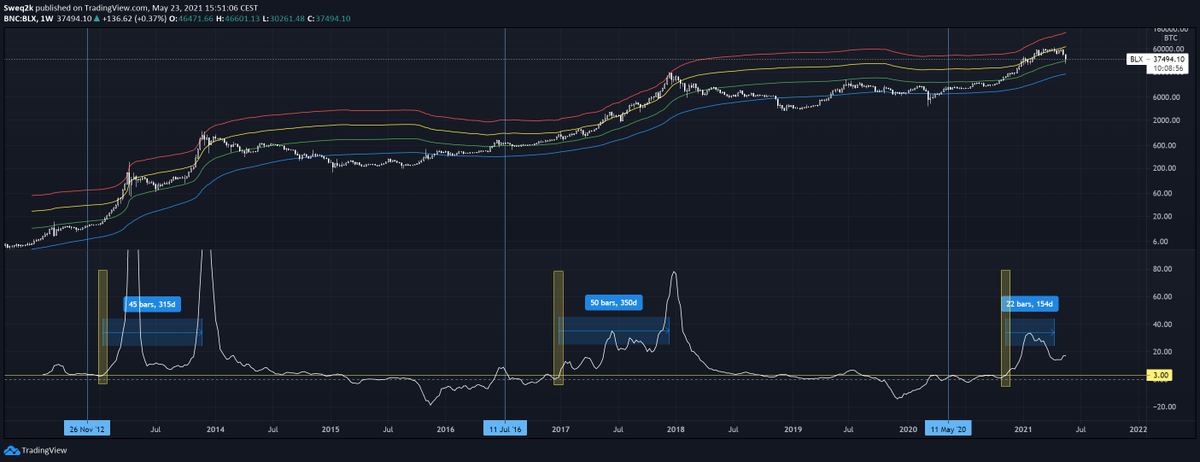
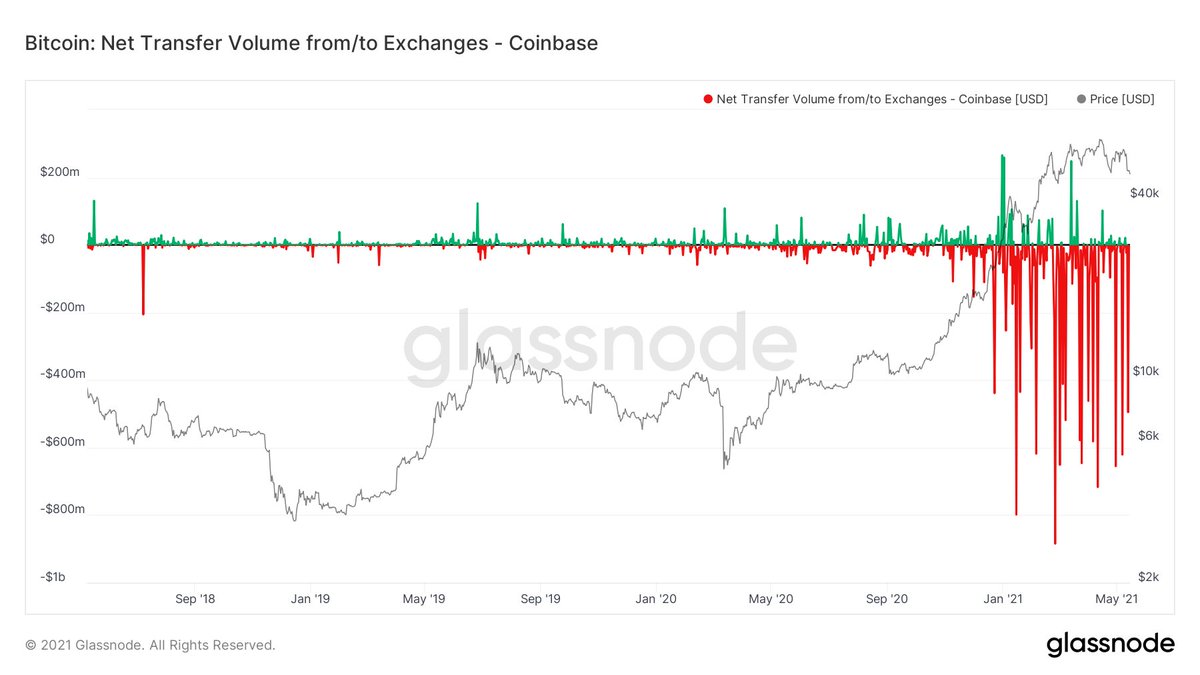
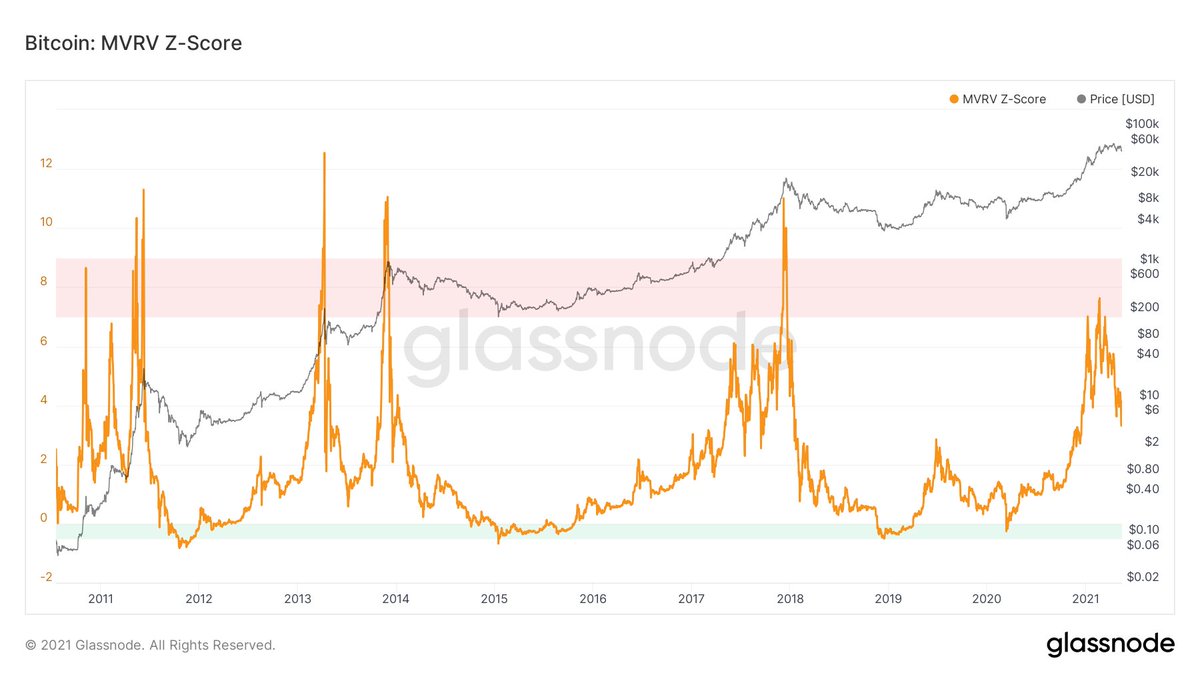
The answer to the fist question I find mostly by analyzing long-term trends of #Bitcoin. I use on-chain market cycle metrics and mainly my S2N ratio with a long setting (100 weeks)
The answer to the fist question I find mostly by analyzing long-term trends of #Bitcoin. I use on-chain market cycle metrics and mainly my S2N ratio with a long setting (100 weeks)
5/15
For question 2, I mostly used my S2N ratio on much shorter time-frames (e.g. 100 days instead of 100 weeks for the macro view). But also traditional metrics such as RSI. I try to keep it simple. So far so good.
For question 2, I mostly used my S2N ratio on much shorter time-frames (e.g. 100 days instead of 100 weeks for the macro view). But also traditional metrics such as RSI. I try to keep it simple. So far so good.
6/15
When I tweeted the analysis above on the 18th I was very convinced that we were close to the end of the correction. What I missed is that we could go so much lower - even if it was a very short period of time.
When I tweeted the analysis above on the 18th I was very convinced that we were close to the end of the correction. What I missed is that we could go so much lower - even if it was a very short period of time.
7/15
I asked myself what I missed and I will from now on clearly look much more also on the futures market, esp. total volumes, funding rates and liquidations. Leverage has become big and I underestimated it in my analysis.
I asked myself what I missed and I will from now on clearly look much more also on the futures market, esp. total volumes, funding rates and liquidations. Leverage has become big and I underestimated it in my analysis.
8/15
Without a clear flush in liquidations and a full reversal of funding rates there is a huge risk of severe price drops - even at levels which the other tools mentioned above already detect as an oversold area - due to potential additional liquidations cascades.
Without a clear flush in liquidations and a full reversal of funding rates there is a huge risk of severe price drops - even at levels which the other tools mentioned above already detect as an oversold area - due to potential additional liquidations cascades.
9/15
There are also other implications such a exchange outages etc. that add fuel to the fire. Others have summarized these effects very well, .e.g.
There are also other implications such a exchange outages etc. that add fuel to the fire. Others have summarized these effects very well, .e.g.
https://twitter.com/RevoltCap/status/1395361814603616259?s=20
10/15
The result for my analyses framework is as follows:
1 - Confirm the macro cycle
2 - Look at shorter term overbought/oversold areas
PLUS
3 - Overlay 2 by assessing the "stability" of this phase by analyzing the leveraged market segment
The result for my analyses framework is as follows:
1 - Confirm the macro cycle
2 - Look at shorter term overbought/oversold areas
PLUS
3 - Overlay 2 by assessing the "stability" of this phase by analyzing the leveraged market segment
11/15
The goal is, firstly, to identify phases - by studying 2 and 3 - within a bull market where you can deploy additional funds aggressively and have an asymmetric R/R profile DESPITE adding during the bull cycle and not ahead of it.
The goal is, firstly, to identify phases - by studying 2 and 3 - within a bull market where you can deploy additional funds aggressively and have an asymmetric R/R profile DESPITE adding during the bull cycle and not ahead of it.
12/15
Secondly, it should help to identify phases where it might be worth to reduce risk, esp. when the macro analyses shows that we might be in the very advanced stages of the bull market.
Secondly, it should help to identify phases where it might be worth to reduce risk, esp. when the macro analyses shows that we might be in the very advanced stages of the bull market.
13/15
I believe that situations where 2 and 3 come together in an oversold area, we have extremely attractive entry points as prices reach levels, where there are actually way more buyers than sellers.
I believe that situations where 2 and 3 come together in an oversold area, we have extremely attractive entry points as prices reach levels, where there are actually way more buyers than sellers.
14/15
I believe this is also what happend these days with the drop to 30k. The quick rebound showed that these were forced levels where actually no one wanted to sell anymore.
I believe this is also what happend these days with the drop to 30k. The quick rebound showed that these were forced levels where actually no one wanted to sell anymore.
15/15
Stay tuned for more analyses on these topics. Let's pump it to 100k soon ;-)
Stay tuned for more analyses on these topics. Let's pump it to 100k soon ;-)
• • •
Missing some Tweet in this thread? You can try to
force a refresh