#Bitcoin update 1/6 
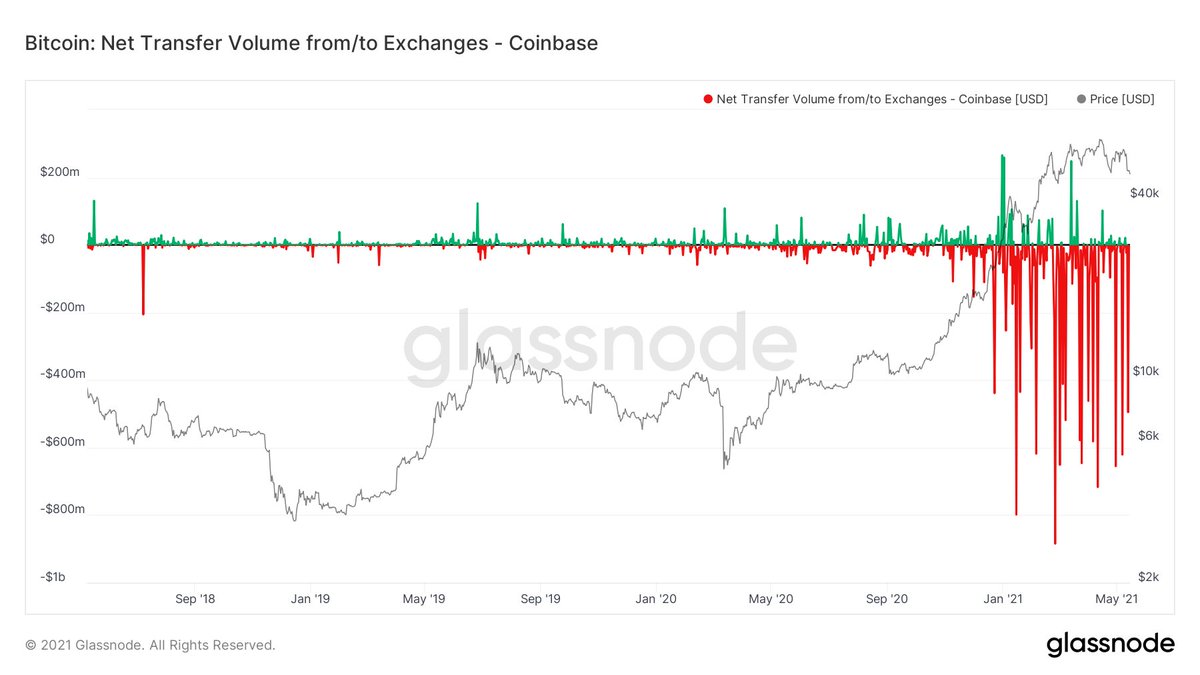
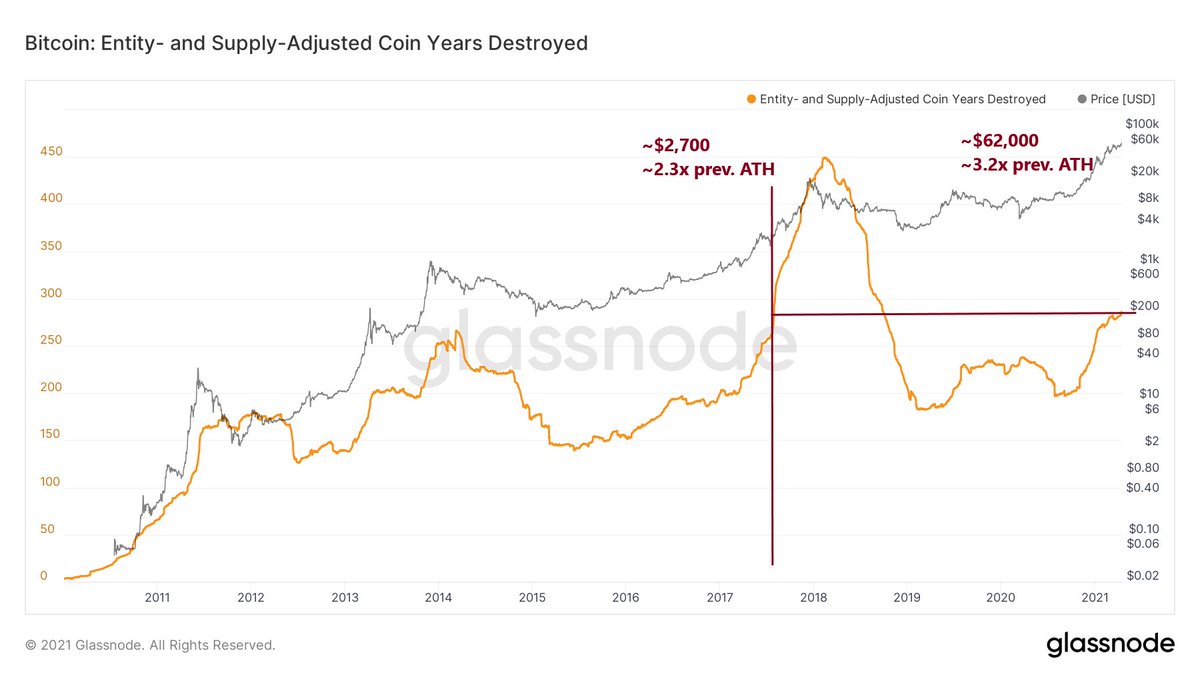
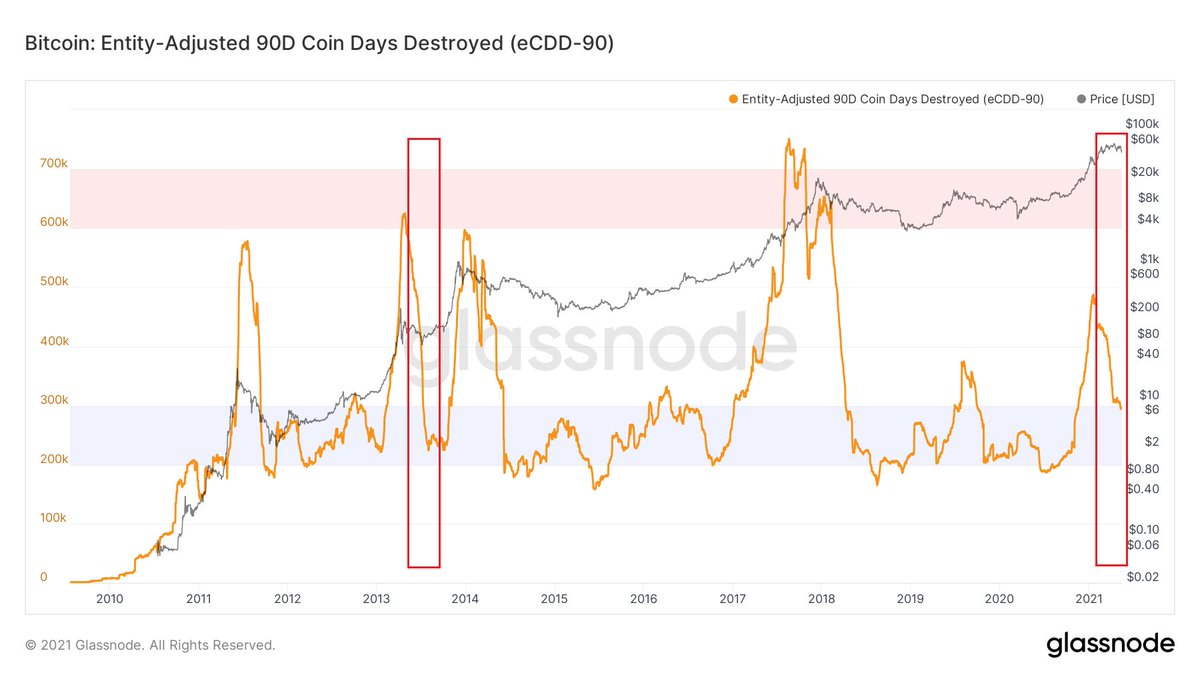
Long-term holder selling slowing is still signaling a high confidence as evidenced by Coin Days Destroyed.
2/6 Historical peaks saw this metric exploding higher into the blow off tops - this has not happend this time, so this makes a macro top unlikely.
Now comes the interesting part:
3/6 
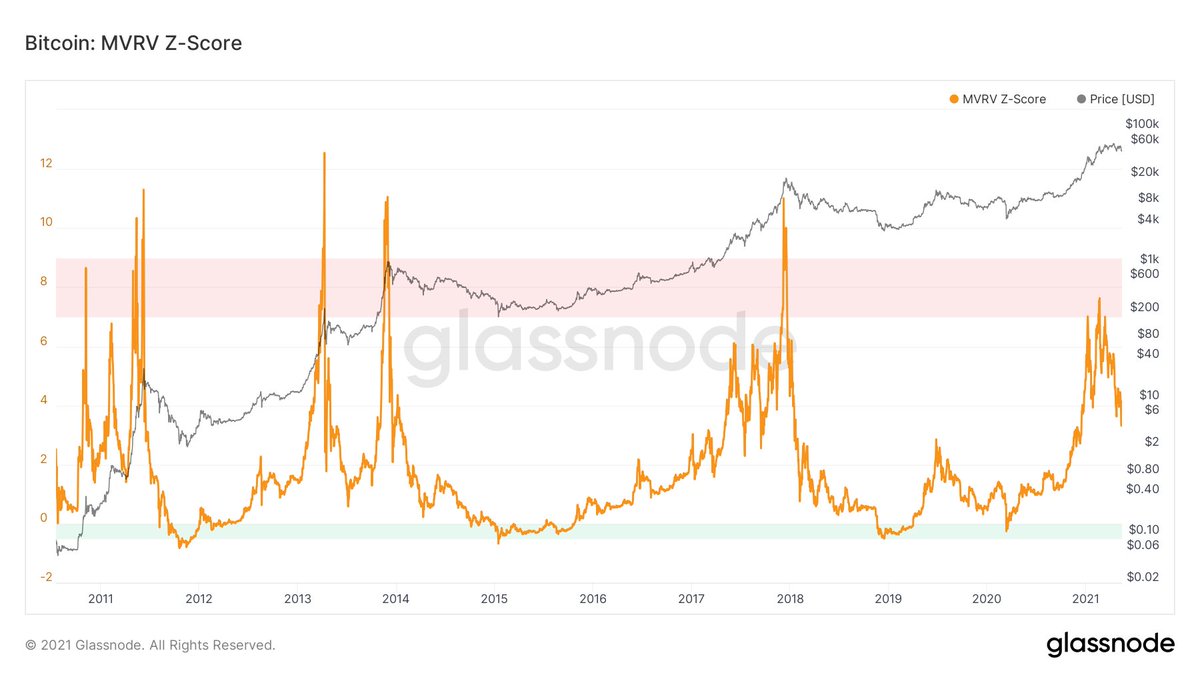
In past cycles, when the metric recovered from the overheated zone to where we are now i) the average drawdown from the previous high was c. 60%.
4/6 When the previous peak was a cycle top the ultimate lows were not in but prices went lower.
5/6 However, in 2013, after the first blow-off top this level coincided with a bottom, from which the second bull cycle started. Due to the similarities of the 2013 cycle to this cycle, this is particularly interesting.
6/6 
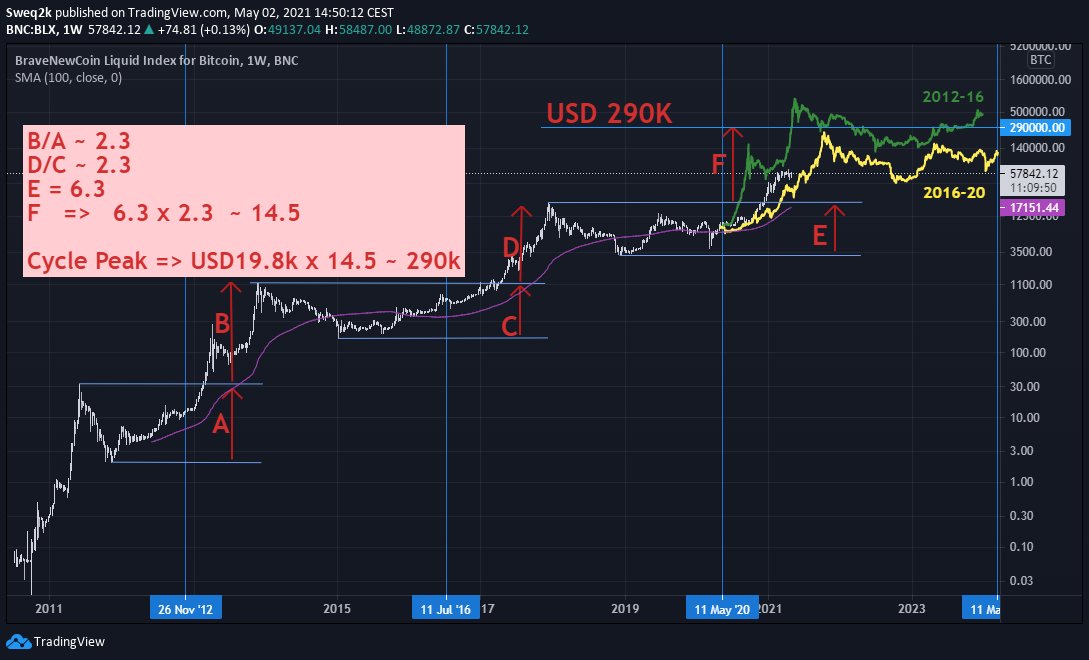
Conclusion: We might have seen the largest part of this correction and a continuation with a further strong leg up is highly likely. Further sideways for some time is possible, but way further down less likely except if FUD intensifies.
• • •
Missing some Tweet in this thread? You can try to
force a refresh
#Bitcoin update 1/5 If you buy into the Options Max Pain theory where market makers have an incentive to push prices of the underlying towards the price where most options expire worthless, there is some short term technical support around the expiry on May 21. Max pain is 54k
2/5 As a lot of put OI is sitting around 47k, pushing prices above this range would result in these puts expiring worthless.
3/5
The 28 May has much more open interest and a max pain at 55k, but this is still some time until expiration, i.e. OI can change, so this only becomes relevant in at least 10 days or so.
#Bitcoin update 1/8 Institutional buyers on Coinbase are accumulating throughout this consolidation phase with another strong outflow just recently.
2/8
Key on chain cycle indicators are leaving their (over)heated ranges and are now at levels from which significant upside has been realized in past cycles.
3/8 When this metric reached values of 4, the bull market was hating up and had in most cases just surpassed the previous high. Average days until the cycle top was c. 240 days. In 2013 it was the longest with 276 days due to the longer interim consolidation phase.
USD 300k per #Bitcoin is possible according to this ratio.
I usually try to avoid price predictions, but next to my S2N-Ratio that also points towards a potential price of 300k, this simple long-term chart confirms this as well.
2/21
The chart shows ratios of 1) the return from the low of a cycle to the previous peak and 2) the return from the previous peak to the new cycle peak. E.g. for previous cycle: low to 2014 peak (C): 7.2x return and 2014 peak to new 2017 peak (D): 16.8x return. 16.8/7.2 = 2.3.
3/21
Interestingly, the ratio for the last two cycles has been 2.3 in both cases. Of course with only two data points the potential for generalization is limited. But after thinking about it, it is actually like a ratio for risk/return from a long-term fully-cycle perspective.
On a morning like this it feels good to almost have no emotion and be reminded that buying and just HODLing #Bitcoin and analyzing the short-term charts rather out of curiosity and risk management - but not trading it - is a good place 2 b. ;-)
2/14
I have reattached my previous tweet above as I still think you can read from it what drives this cycle and makes it very robust and it answers the questions to many metrics that we currently regularly see, like decreasing liquid supply/ balance on exchanges etc.
3/14
This is my fundamental view for this cycle and it does not change. In the shorter term, we have now broken the most recent up-trend and the break-out of the declining momentum trend (S2N Ratio, lower chart), which I was so excited about, got reversed.
#Bitcoin update - this one is important 1/n This chart shows the entity and supply adjusted coin years destroyed and I think it is bullish as hell and shows how this cycle is different and why we see certain trends such as declining exchange balances.
Thread 👇
2/n The metric shows the rolling sum over 1 year of coin days destroyed. When it rises, more older coins got sold and this signals that longer-term holders are less confident in further upside and/or realize profits.
3/n If we compare the current level to 2017, we were only at price of $2,700, which was 2.3 times higher than the previous cycle peak, whereas today we are already at 3.2x the previous cycle peak. The incentive to sell comparing the stages in the cycles would be higher today!
The next leg up could take us to >100k if volatility dynamics repeat from past cycle.
Thread👇
2/n The first indicator "ATR-Ratio" shows the ratio of short term (10 days) to medium term volatility (100 days). Higher values indicate higher volatility then trend and vice versa.
3/n In early 2017, we have interestingly seen a very similar volatility pattern to the current one, i.e. a pattern with three spikes followed by very low vola until late April. The next move higher in 2017 was over 2x from there.