#Bitcoin update
1/12
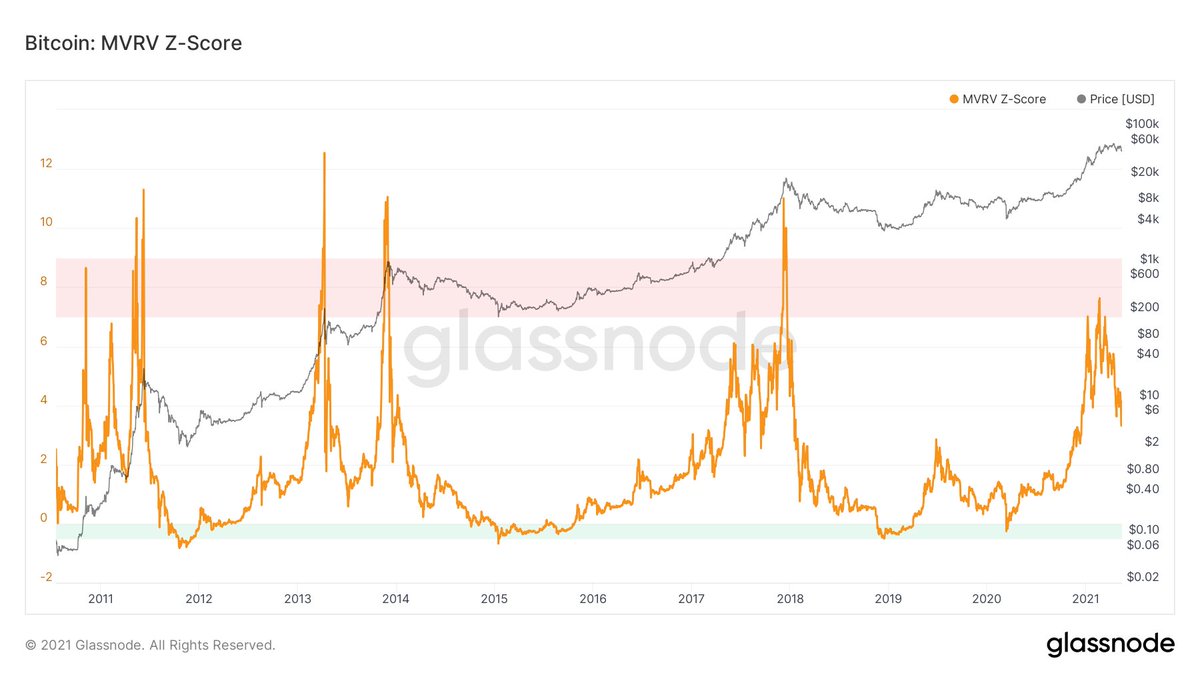
The key question is whether we are still in a bull market.
I took a different look at this question in terms of a new way of measuring cycle lengths through my S2N Ratio model.
Thread 👇
1/12
The key question is whether we are still in a bull market.
I took a different look at this question in terms of a new way of measuring cycle lengths through my S2N Ratio model.
Thread 👇
2/12
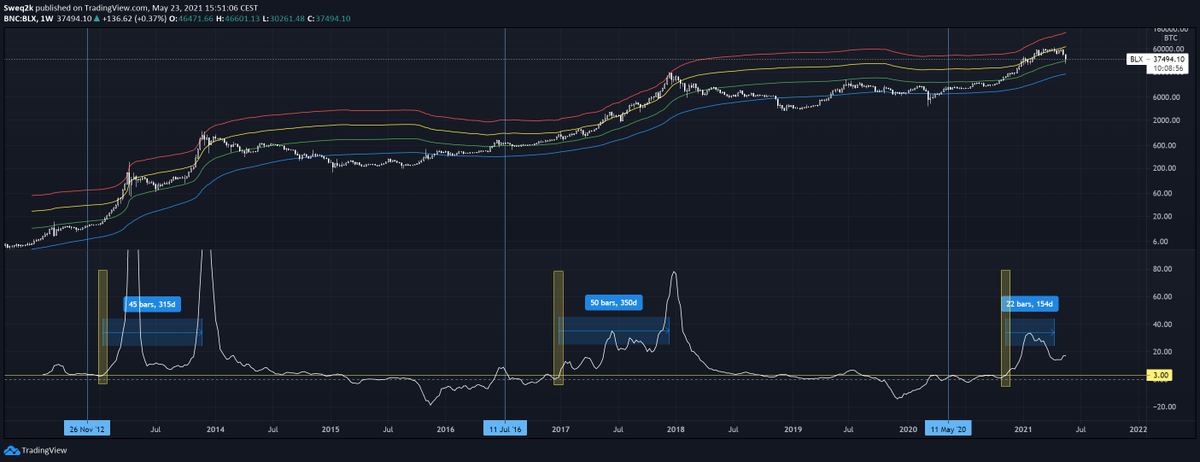
What I have done in the chart is to graph the S2N ratio on the chart to indicate the key levels. The red line, is where the S2N reaches 35, i.e. price is 35 vol units away from 200 week MA.
What I have done in the chart is to graph the S2N ratio on the chart to indicate the key levels. The red line, is where the S2N reaches 35, i.e. price is 35 vol units away from 200 week MA.
3/12
Touching the red lines is where market peaks happened in the past. This was clearly not the case this time and I mentioned it before and this is also not the point I want to repeat again today.
Touching the red lines is where market peaks happened in the past. This was clearly not the case this time and I mentioned it before and this is also not the point I want to repeat again today.
4/12
Instead, I wanted to assess the aspect of time, i.e. the length of the cycle and compare it with past cycles.
Instead, I wanted to assess the aspect of time, i.e. the length of the cycle and compare it with past cycles.
5/12
Typically, this is done by comparing cycles since their halving dates or when they reached the previous ATHs. I was looking for something more "objective".
Typically, this is done by comparing cycles since their halving dates or when they reached the previous ATHs. I was looking for something more "objective".
6/12
What I did is to measure the slope of the S2N bands (lower chart) and calculated the time frames for the cycle starts from when the cycles were indeed heating up meaningfully - always based on the same measurements.
What I did is to measure the slope of the S2N bands (lower chart) and calculated the time frames for the cycle starts from when the cycles were indeed heating up meaningfully - always based on the same measurements.
7/12
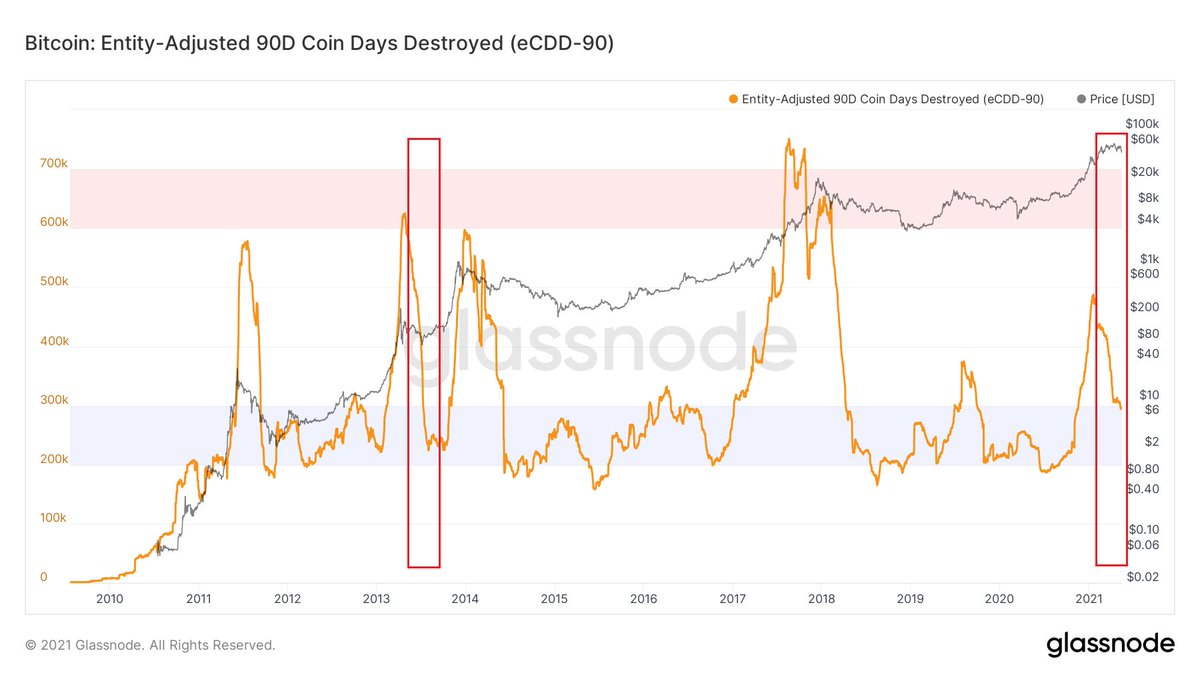
The 2013 and 2017 cycles both saw a length of 315 and 350 days. If the April ATH would have been a top, the cycle would have only lasted 154 days and would have happened not at a peak of price momentum but at an already slowing point of momentum.
The 2013 and 2017 cycles both saw a length of 315 and 350 days. If the April ATH would have been a top, the cycle would have only lasted 154 days and would have happened not at a peak of price momentum but at an already slowing point of momentum.
8/12
This supports my conclusion from earlier, that we will most likely see something similar that happened in 2013. I also believe in lengthening of cycles and could therefore well see a longer phase of consolidation with a strong bull run in Q4/Q1 into the final top.
This supports my conclusion from earlier, that we will most likely see something similar that happened in 2013. I also believe in lengthening of cycles and could therefore well see a longer phase of consolidation with a strong bull run in Q4/Q1 into the final top.
9/12
The 2013 highs of April were also only broken in Q4 later that year, so a longer consolidation during the bull market would be nothing new.
The 2013 highs of April were also only broken in Q4 later that year, so a longer consolidation during the bull market would be nothing new.
10/12
From a broader picture, I would also expect a supportive macro environment later this year. I could see growth and inflation slowing down due to the decreasing base effects and therefore also yields not further increasing.
From a broader picture, I would also expect a supportive macro environment later this year. I could see growth and inflation slowing down due to the decreasing base effects and therefore also yields not further increasing.
11/12
This would reduce concerns of tightening of policy. The gold price also seems to be sniffing this already. In such an environment also tech stocks could see a massive bull run again. Such a scenario would be very supportive for a strong second leg for #Bitcoin.
This would reduce concerns of tightening of policy. The gold price also seems to be sniffing this already. In such an environment also tech stocks could see a massive bull run again. Such a scenario would be very supportive for a strong second leg for #Bitcoin.
12/12
Conclusion:
- Likely no top yet
- Likely longer consolidation
- Good accumulation opportunities
- Potentially strong bull market in Q4/Q1
- Potentially supportive macro environment later this year that would provide support
Conclusion:
- Likely no top yet
- Likely longer consolidation
- Good accumulation opportunities
- Potentially strong bull market in Q4/Q1
- Potentially supportive macro environment later this year that would provide support
• • •
Missing some Tweet in this thread? You can try to
force a refresh