📣 Weekly Update: A Picture's Worth a Thousand Words, etc:
acasignups.net/21/05/24/weekl…
acasignups.net/21/05/24/weekl…
Percent of ENTIRE POPULATION vaccinated for #COVID19 by state & partisan lean as of yesterday: 

Here it is with the dots adjusted for population. R2 = 0.6686. Note that this is *not* weighted for population even if the dots are sized that way: 

Here's every state graphed by education (% over 25 yrs old w/bachelor's degree or higher). Notice that there's a pretty high correlation here as well...but not as high as when measured by partisan lean. 

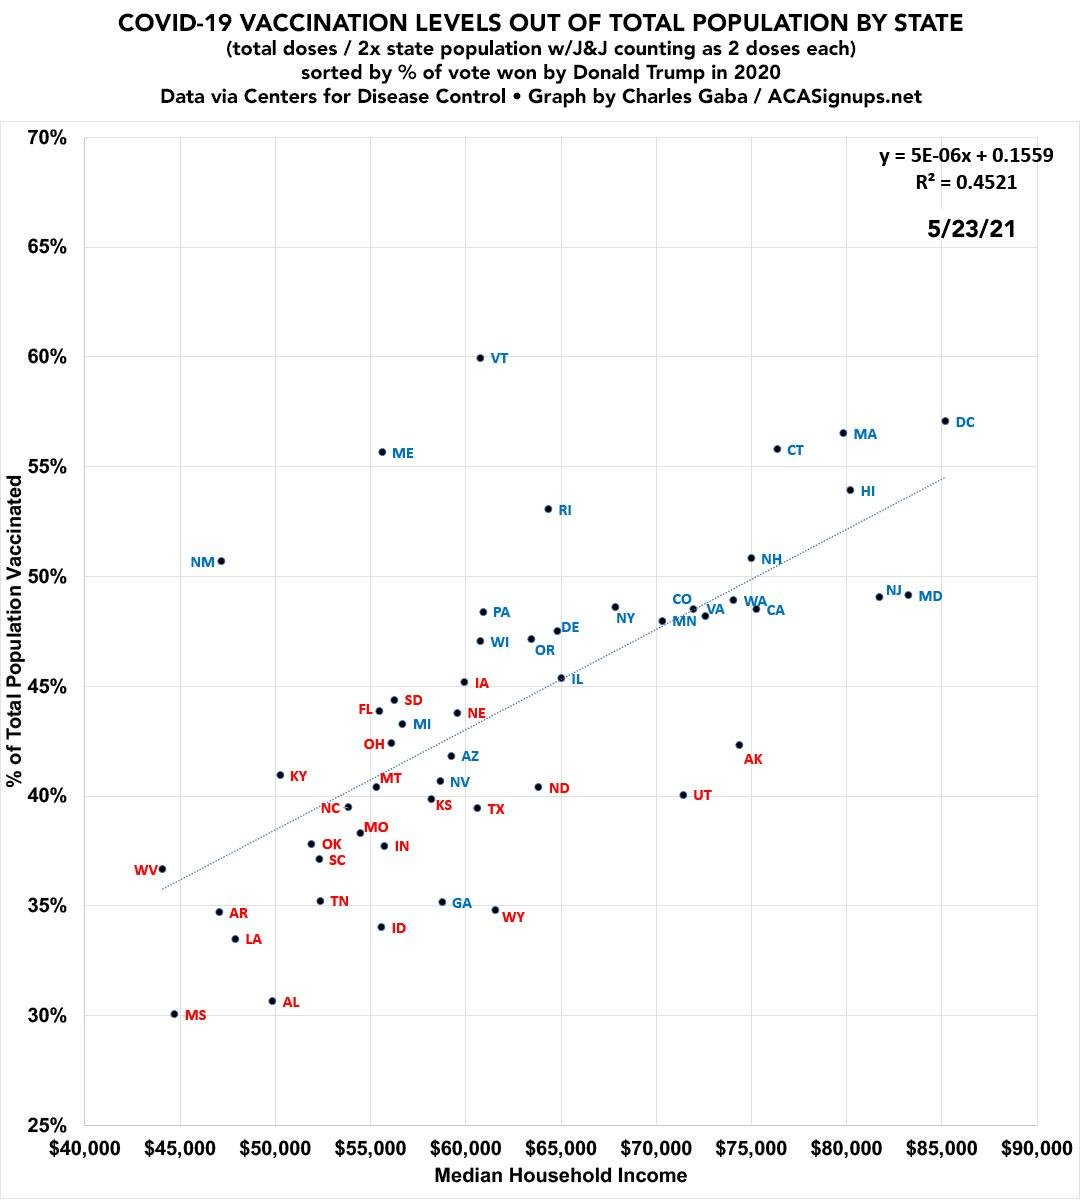
Here it is graphed by median household income. Again, there's a solid correlation...but not nearly as high as partisan lean: 

Finally, here's what it looks like when sorted by what % of the total population is Black. On the surface there appears to be almost NO correlation at all--except even that's pretty telling when you keep looking. 

• • •
Missing some Tweet in this thread? You can try to
force a refresh


