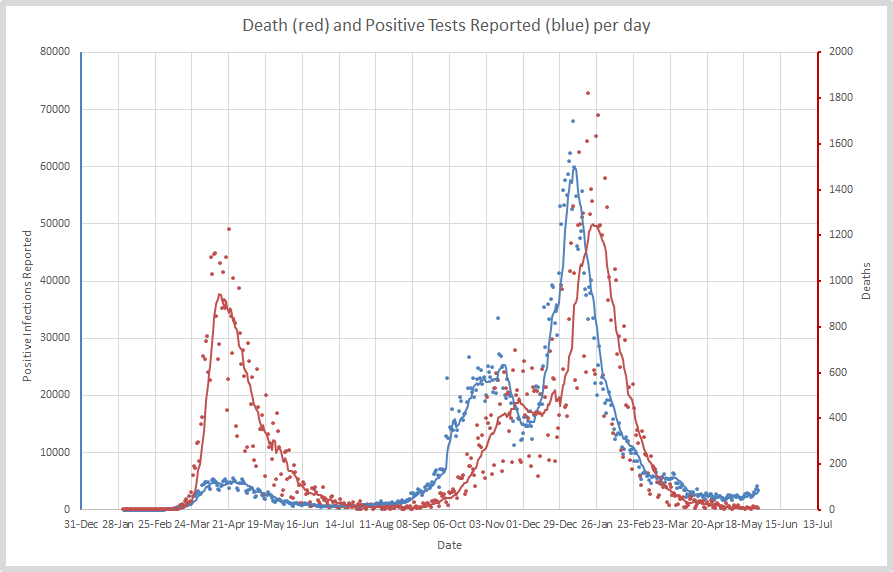
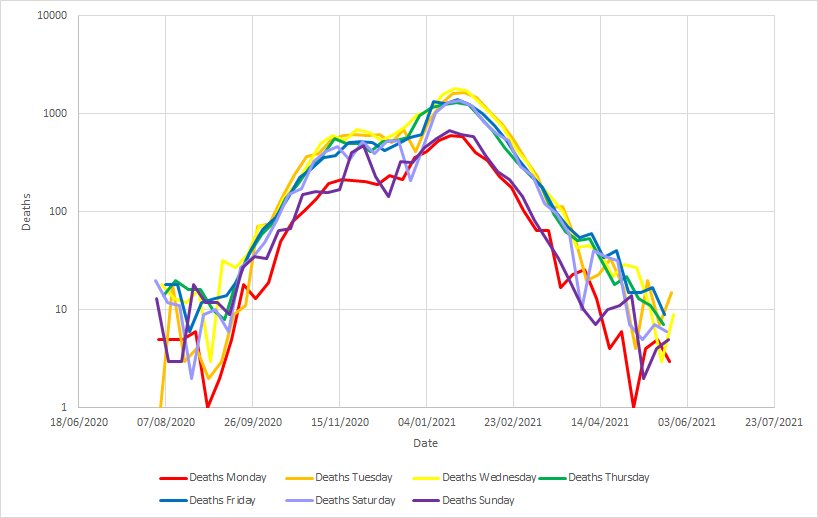
Things are suddenly going wrong. Here's the overall Covid picture in the UK now - cases and deaths are rising (1) Image
Have a look at the recent trends on log plots. Its early days to be certain deaths are going up - 3 days in a row is concerning but not conclusive. Cases are rising faster though, today was over-trend (2) Image
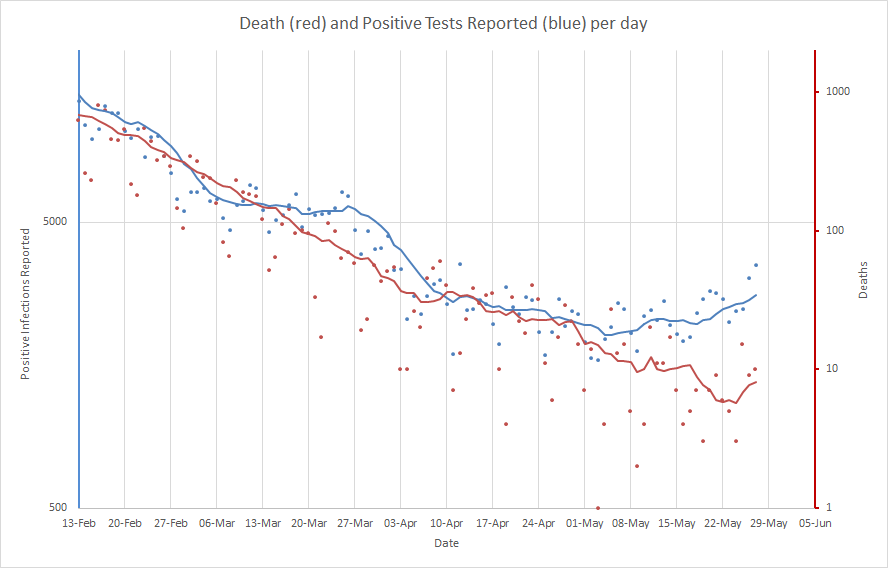
In fact, deaths have risen for 4 of the last 7. (3) Image
We're up to 8.41 per day from a low of 5.71. From yesterday to today translates to a deaths doubling time of just under 13 days (4) Image
Deaths are rising at 2.4% per day, on average over 7 days. If this turns into a new trend its a serious problem (5) Image
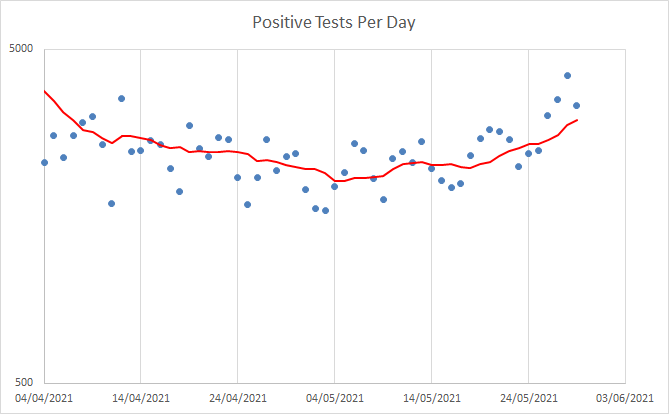
Positive tests ,on the other hand, are obviously now rising ever faster. 2.7% per day on average. Obviously any rise in deaths lags behind a rise in recorded cases (6) Image
The data is a little turbulent as yet, but cases at present are doubling every 20 days, more or less. And thats getting faster (7) Image
R as back calculated from deaths (to the 4th of this months, the average day those who died today caught it) was at the highest point since December 20th. But with the number of deaths being low thats a less reliable measure. (8)
For infections we're seeing R settling out to a little over 1.1 (9) Image
Cases are rising. Death are rising. At this stage recovering from the first wave we were trundling along at the bottom, approaching but still a way shy of the start of wave 2 (10) Image
With vaccinations as they are now, we ought to be doing far better - but the Indian variant is more infectious. (11)
Why aren't vaccinations stopping it yet? Because (a) mass infection was allowed here, creating the Kent variant, and (b) we opened up our borders to the even worse Indian strain. Thats explained here (12)
How bad will this rise get? We don't know. We haven't really got enough data on how the vaccines interact with the Indian strain. But we shouldn't be in this position. We would, with the original strain, be at a herd immunity from vaccination by now. (13)
We didn't defeat this because we opened up from lockdown 1 too fast, saw mass infection, created the Kent strain and then allowed the Indian one in. We had this disease on the ropes and we let it back at us. EVERY death now is needless. (14)
We have made the same mistakes repeatedly. Whats the chances we won't this time? Be angry. Stay angry. Never forget - this is Johnsons catastrophe. (fin)

• • •

Missing some Tweet in this thread? You can try to force a refresh
 

Keep Current with Cab Davidson #FBPE

Cab Davidson #FBPE Profile picture

Stay in touch and get notified when new unrolls are available from this author!

Read all threads

This Thread may be Removed Anytime!

PDF

Twitter may remove this content at anytime! Save it as PDF for later use!

Try unrolling a thread yourself!

how to unroll video
  1. Follow @ThreadReaderApp to mention us!

  2. From a Twitter thread mention us with a keyword "unroll"
@threadreaderapp unroll

Practice here first or read more on our help page!

More from @gnomeicide

29 May
Both deaths and cases up on last Saturday. The Covid-19 picture in the UK is looking pretty crap right now. I'll try and explain whats happening. Here's the overall picture (1) Image
Even on the overall picture you can see that cases are rising. But here's a look at the recent trends on log plots, its very clear death and cases are now rising (2) Image
Cases started rising in early May. Around the 4th... (3) Image
Read 13 tweets
27 May
In Britain right now 38,376,564 have had 1 dose of vaccine, 23,618,498 have had 2 doses. Assuming 90% efficacy of 2 doses in stopping spread, 50% of 1 dose, and THE ORIGINAL STRAIN of Covid with a published R0 of 5.7 this is where we would be Image
The Kent strain is between 30% and 70% more infectious. Here's what it looks like with our current rate of vaccination assuming the mid point of that (55%) Image
Or, in other words, we're still not able to fully unlock because we didn't work hard enough to avoid variants emerging, we allowed infection to spread and create this problem. This is directly and absolutely a failing in government policy in the UK. How about the Indian strain?
Read 7 tweets
26 May
I said yesterday that over the next few days we would see over 3000 infections in a day soon. Today, it was 3180, and 9 deaths. This takes a little unpacking. Here's the overall picture now (1) Image
Have a look at the recent trends for both infections and deaths on log plots. Cases are rising, deaths are basically static and perhaps rising again, but its hard to be certain (2) Image
The overall trend for deaths is worrying. For 3 of the last 4 days we saw more deaths reported than the same day the previous week (3) Image
Read 13 tweets
14 Feb
Covid-19 deaths and infections are settling in to pretty regular trends right now, but explaining what that really means will take a moment or three. Here's the overall picture (1)
Have a look at that on a log graph - note two different scales here, but its important you get a closer look at whats happening (2)
A straight line on a log plot means a constant proportional rate. It turns a constant curve into a straight line. So a linear graph might be 1, 2, 3, 4, 5, but a straight line on a log plot would be 1, 2, 4, 8, 16. (3)
Read 18 tweets
12 Feb
Fyi @SouthCambs @jdjhiston - Kings Hedges Road, South Side, under the trees. Surprised its South Cambs and not Cambridge. Colossal amount of fly tipping, much is years old. ImageImageImageImage
Could add loads more pics if you need. Have eventually manages to report it through your website. It'll be awfully hard to deal with this when the undergrowth grows back up in Spring. There is A LOT of waste. A lot.
I had a walk in and out under the trees there and liberated assorted inflatable balls (footballs, rugby balls, a volleyball) that'll be cleaned, pumped and hoiked out onto the playing fields where kids will find them...
Read 5 tweets
9 Feb
I've been trying to fit trends to whats happening with Covid-19 data in the UK and I think we may just be seeing some trends emerge. Here's the overall picture - recorded cases and deaths continue to fall (1)
Here's a closer look at the recent trends, on a log scale. You can see that there's a straight line for how fast cases are declining on the log graph, making it a regular proportional drop, whereas deaths are still curving downwards (2)
What does that mean? Well in terms of positive test results it means we saw a fall in positive tests from around the 4th to the 17th of January, and while that fall continues now its no longer accelerating, its more or less a constant 4% fall per day now. Roughly. (3)
Read 19 tweets

Did Thread Reader help you today?

Support us! We are indie developers!


This site is made by just two indie developers on a laptop doing marketing, support and development! Read more about the story.

Become a Premium Member ($3/month or $30/year) and get exclusive features!

Become Premium

Too expensive? Make a small donation by buying us coffee ($5) or help with server cost ($10)

Donate via Paypal Become our Patreon

Thank you for your support!

Follow Us on Twitter!

:(