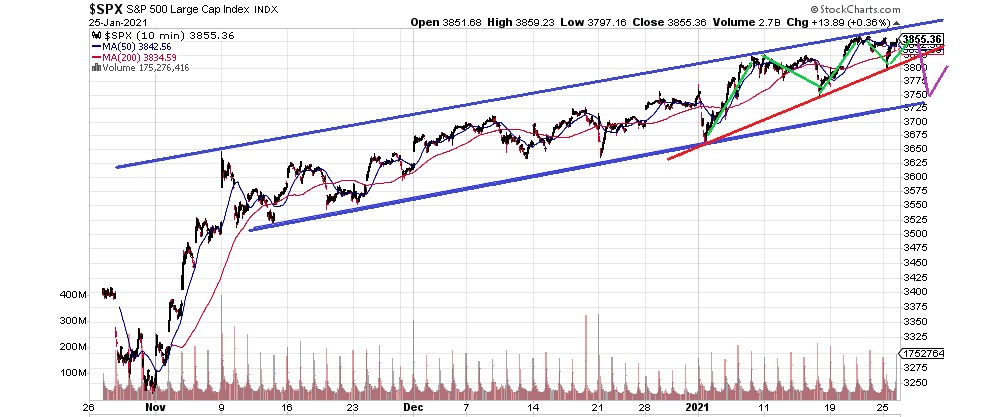
1/ Chart study from Dragon's Den. Chart posted below on May 28 with current inset on top. So far so good. Another major time zone 6-7 to 6-9/11. Goods odds of drop to black channel ~4140 starting Monday.
2/ Lower black channel is super important so watch carefully. Break that and a slight alternate to above says we're done just in case.
3/ For now, let's assume black channel holds. The fractal pattern posted last week is also holding and that means time for another one of those green zigzags down.
4/ Either way, we are at or close to a major high. May 10th was extremely significant and though it has been nearly a month since, and there has been no significant decline *yet*, we have also yet to make a new closing high since then. Is June 7 secondary top?
5/ Tech has already broken and signs for another reversal lower abound. $ARKK for one has a perfect back test of triangle which happens to be at price where 50 and 200 MA converges and all on falling volume. 80's at a min coming up next
6/ Some like $GOOG haven't broken yet, but clearly in terminating wedge with little room left AND all on falling volume here too. Once lower blue line breaks, 2000 and maybe 1800 will come fast
7/ Let's talk $NVDA. I find symmetrical patterns like this amazing. 650 next.
8/ Commodities have been on an inflationary tear, but if oil has anything to say, it may be sending a clue that deflation is around the corner. 5 wave wedge, falling volume and clearly the last leg momentum is dying. Major trend line tag coming too.
9/ $VIX. Chart says it all. MAJOR.
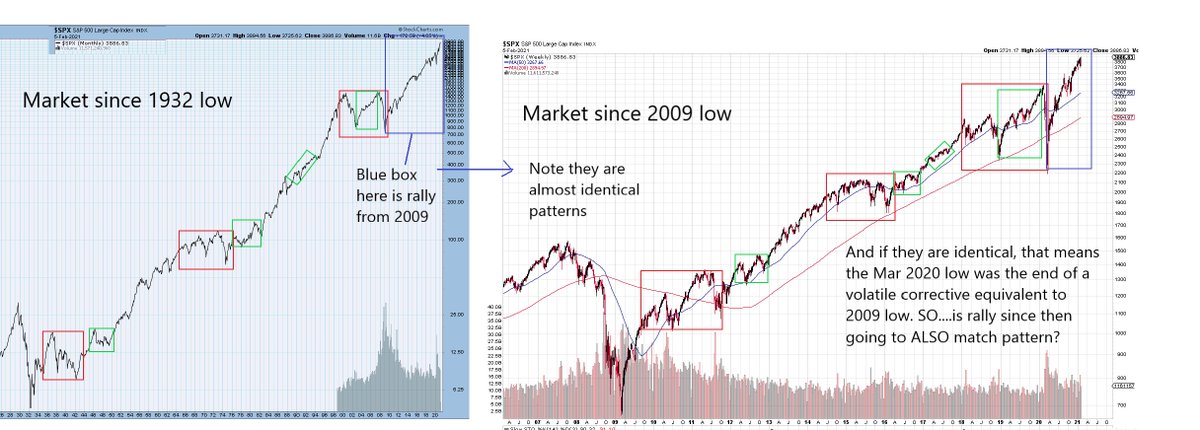
10/ Weekly S&P. While not for timing, tons of clues we are nearing major peak on the run since 2009.
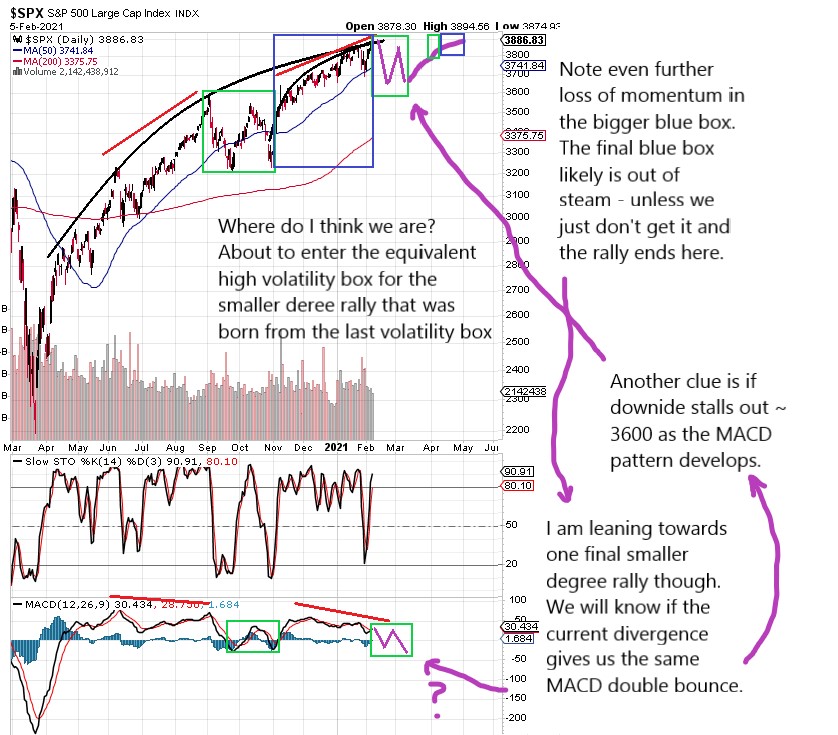
11/ Given all the clues, we are still in wedge since Nov 2020 but range is narrowing and weakness building. 4400 is top wedge max but we likely fall well short of that and time is running out. Break 4140 - stick a fork in this pig of a market and the great unraveling begins. End
• • •
Missing some Tweet in this thread? You can try to
force a refresh
1/ Can't help to see how eerily similar the set up is. June 7-9-11 is Major window. Does the centerpoint on 9th finally break? STILL have not closed above May 10 high.
2/ I am not seeing strength here. Potential ending fractal where there is a rally in green and red corrective. However, each "break" results in a substantially weaker rally. The B wave top of each red for first 2 were both gap and crap. Out of room on the last one.
3/ $AAPL Seeing trouble. That's a valid 3 wave corrective bear flag on the right and on falling volume. Possible HS also with falling volume targets 103 on the break. Major market general here could help take down the market.
1/ Chart study from the Dragon's Den. Bank index first. $BKX
2/ Weekly. Major RSI spikes catch significant highs and lows leading to pauses or more likely, reversal. Large ABC pattern looks complete. B wave classic flat.
3/ $BKX ABC-X-ABC zigzag since Oct is pretty clean. B waves channel perfectly for textbook structure. Not much more to go.
1/ You don't have to trade every day to make good money. In fact, shorter term time frames can actually be more challenging because signals are influence by higher time and lower time frames. Let things line up and take the few trades that REALLY skew things in your favor.
2/ Commodities are about to hit a brick wall. Everyone says inflation. NO!! Weeklies are awesome for long term. Line up RSI and buyer/seller ADX spikes for best results. Throw in some trend lines which correlate and you have a perfect set up.
3/ Time frames are absolutely critical. Buyer/seller or RSI spikes on the monthly may be good for more than a year. Weekly for 6-12 months. Daily for 1-4 months. 60 min - 1-3 weeks. Don't overplay signals
1/ Chart Study from Dragon's Den. Been a while, but this is just a short one. Let's start with the BIG picture. Entire rally from 1932 and rally from 2009 are IDENTICAL. It's a nested pattern
2/ So if nesting, the rally from Mar 2020 low should again be like pattern from 2009. Just one degree smaller. I think it is close.
3/ Here is a close up of move from 2020. Same pattern but one difference. We are losing momentum. Do we have one more smaller cycle left? Maybe
1/ Futures down tonight. 2 things. 1) I don't like big gaps near the high. Odds favor it is recovered. 2) No break until the lower blue line breaks. As long as the gap down stays above this, watch for rally to fill gap.
2/ That said, this is the final segment in the wedge and there is likely a lot of overlap but no more than 3 clear waves. once gap fills, that may be it so a terminal end is upon us.
3/ Once the lower wedge breaks though, next should be the lower parallel line here. We are seeing downside moves appear swiftly and this may continue to hold true with little time to react. I suspect that lower lines proves to be another bounce point tho.
1. Want to see what happens to irrational markets? In 1999-2000, the NDX went a little more than double over the span of 5 months. When it turned, 25% was lost in 7 trading days. After a strong bounce, it dropped again losing overall 35% in 3 weeks.
2. After another longer bounce and drop, the total was 40% down. It managed to recover ~62% of that in the months that followed.
3. BTFD crowd rejoiced that we are off again - not knowing that 2 years later the index would lose 85% of it's value.