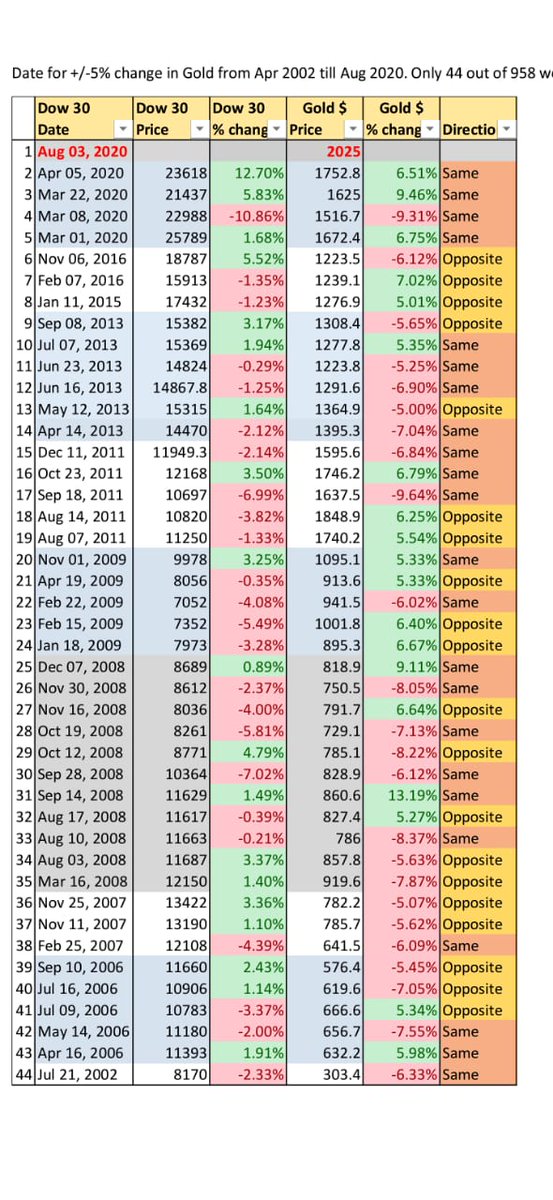
1/n
Thread on Intermarket Relationship 1999-2021
Historical Correlation between #US30 #DowJones, #US100 #Nasdaq, #Gold #XAUUSD, #Brent #Crude, #copper #US10Y
1. US 30 / US 100 vs US 10Y
US30 / US100 was at ~2 multiple in 2000 and it is now at same level in 2021
Thread on Intermarket Relationship 1999-2021
Historical Correlation between #US30 #DowJones, #US100 #Nasdaq, #Gold #XAUUSD, #Brent #Crude, #copper #US10Y
1. US 30 / US 100 vs US 10Y
US30 / US100 was at ~2 multiple in 2000 and it is now at same level in 2021

2/n
Above chart shows that sole factor responsible for this anomaly is US 10Y rates
Rates were kept for real economy to recover, generation of jobs etc. however it has clearly backfired.
US Tech definitely does not deserve this kind of valuation
Above chart shows that sole factor responsible for this anomaly is US 10Y rates
Rates were kept for real economy to recover, generation of jobs etc. however it has clearly backfired.
US Tech definitely does not deserve this kind of valuation
3/n
The multiple of 2 in 2000 went to 9 in 2001 represents the US tech bubble burst.
In todays terms if 2 were to go to 9, Dow would be at 25000 and Nasdaq ~2700 or any such other level. It may not hit 9 since tech has much larger role to play today vs 2000,
The multiple of 2 in 2000 went to 9 in 2001 represents the US tech bubble burst.
In todays terms if 2 were to go to 9, Dow would be at 25000 and Nasdaq ~2700 or any such other level. It may not hit 9 since tech has much larger role to play today vs 2000,
4/n
however multiple of 5-6 is certainly a possibility
No wonder US 100 pukes the moment rates move higher
2. US 100 vs US 10Y
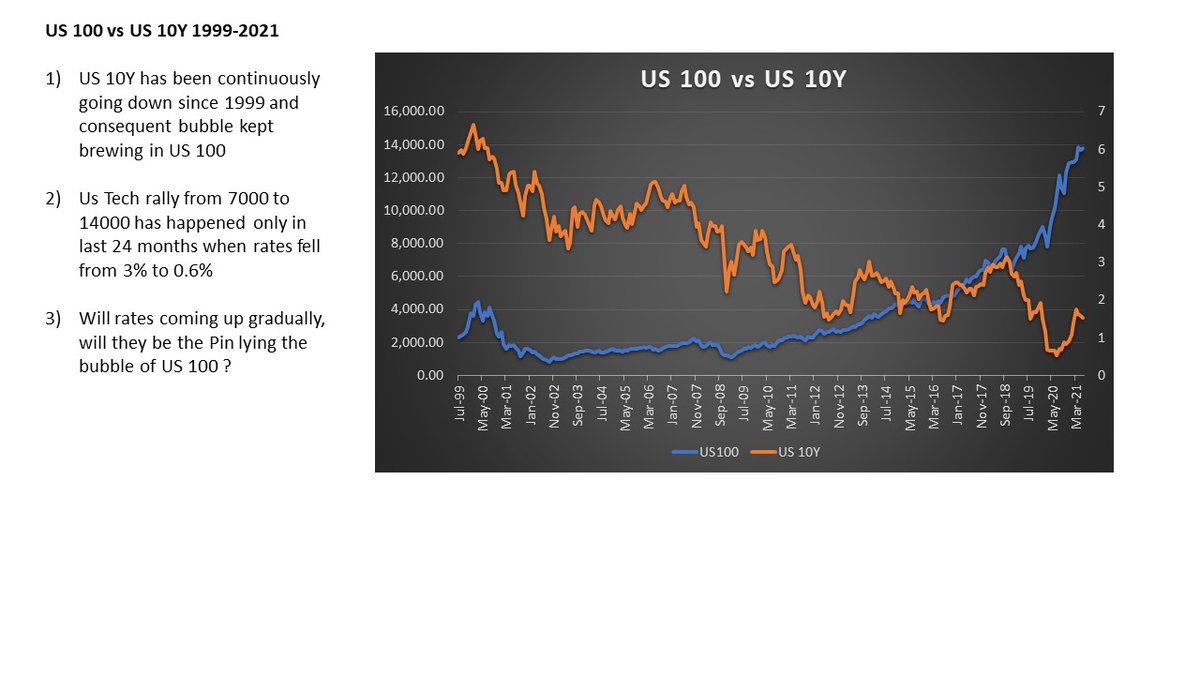
US 10Y has been continuously going down since 1999 and consequent bubble kept brewing in US 100
however multiple of 5-6 is certainly a possibility
No wonder US 100 pukes the moment rates move higher
2. US 100 vs US 10Y
US 10Y has been continuously going down since 1999 and consequent bubble kept brewing in US 100
5/n
Us Tech rally from 7000 to 14000 has happened only in last 24 months when rates fell from 3% to 0.6%
Will rates coming up gradually, will they be the Pin lying the bubble of US 100 ?
3. US 30 vs Oil (Danger here)
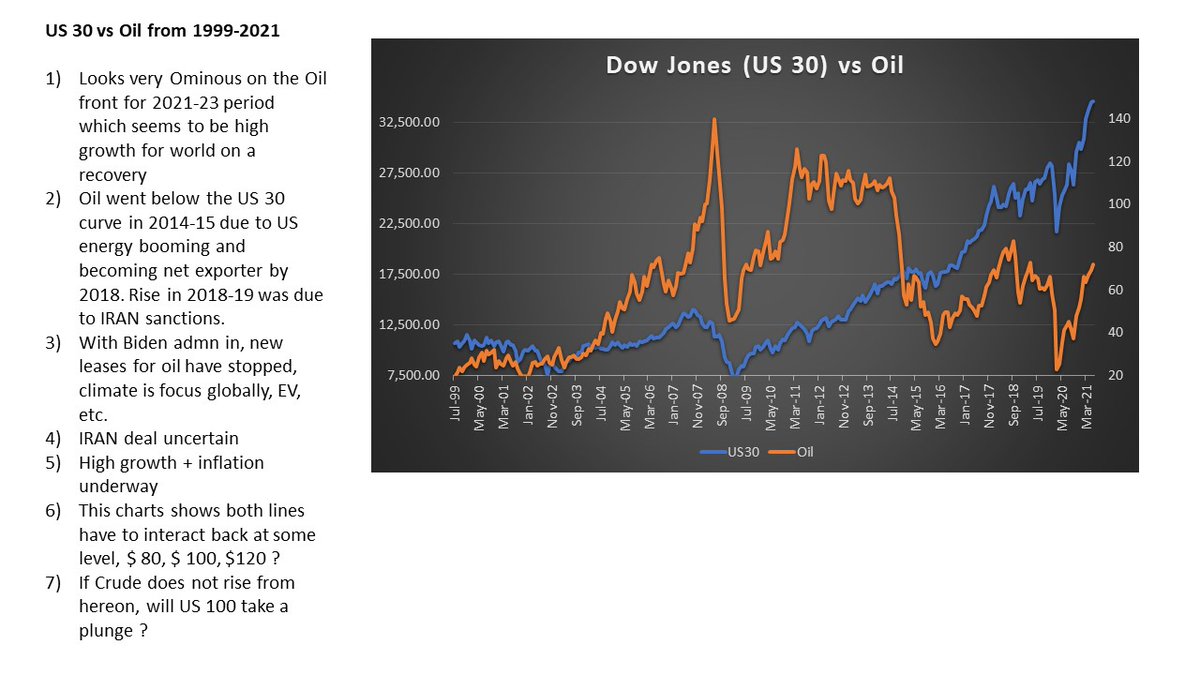
Looks very Ominous on the Oil front for 2021-23 period
Us Tech rally from 7000 to 14000 has happened only in last 24 months when rates fell from 3% to 0.6%
Will rates coming up gradually, will they be the Pin lying the bubble of US 100 ?
3. US 30 vs Oil (Danger here)
Looks very Ominous on the Oil front for 2021-23 period
6/n
which seems to be high growth for world on a recovery
Oil went below the US 30 curve in 2014-15 due to US energy booming and becoming net exporter by 2018. Rise in 2018-19 was due to IRAN sanctions.
With Biden admn, new leases for oil stopped, climate is focus, EV, etc.
which seems to be high growth for world on a recovery
Oil went below the US 30 curve in 2014-15 due to US energy booming and becoming net exporter by 2018. Rise in 2018-19 was due to IRAN sanctions.
With Biden admn, new leases for oil stopped, climate is focus, EV, etc.
7/n
IRAN deal uncertain
High growth + inflation underway
This charts shows both lines have to interact back at some level, $ 80, $ 100, $120 ?
If Crude does not rise from hereon, will US 100 take a plunge ?
IRAN deal uncertain
High growth + inflation underway
This charts shows both lines have to interact back at some level, $ 80, $ 100, $120 ?
If Crude does not rise from hereon, will US 100 take a plunge ?
8/n
4. DXY vs Oil
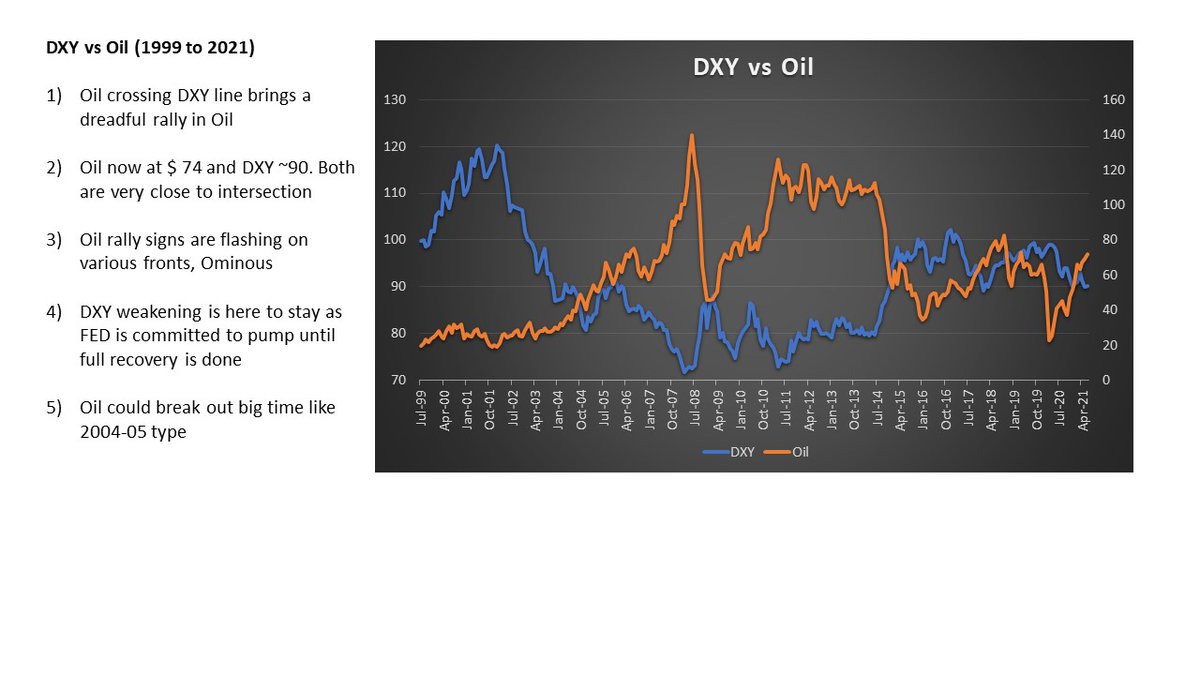
Oil crossing DXY line brings a dreadful rally in Oil
Oil now at $ 74 and DXY ~90. Both are very close to intersection
Oil rally signs are flashing on various fronts, Ominous
DXY weakening is here to stay as FED is committed to pump until full recovery
4. DXY vs Oil
Oil crossing DXY line brings a dreadful rally in Oil
Oil now at $ 74 and DXY ~90. Both are very close to intersection
Oil rally signs are flashing on various fronts, Ominous
DXY weakening is here to stay as FED is committed to pump until full recovery
9/n
Oil cld break out big time like 2004-05 type
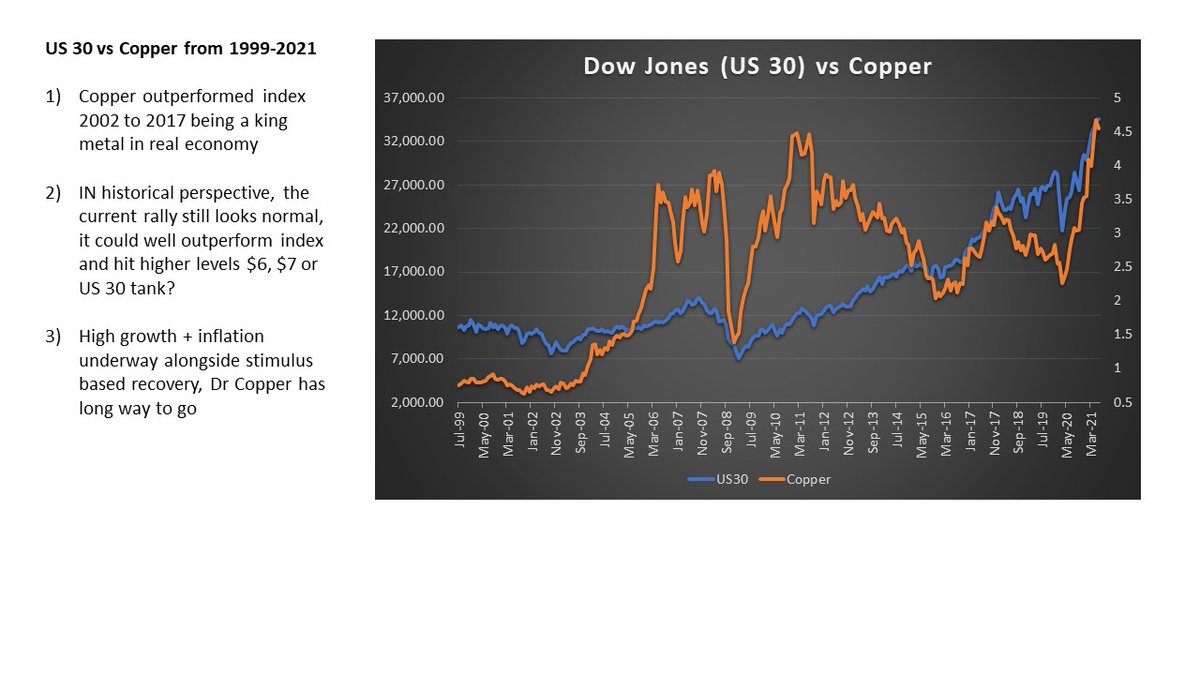
5. US 30 vs Copper
Copper outperformed index 2002 to 2017 being a king metal in real economy
IN historicl perspective, current rally still looks normal, it could well outperform index & hit higher levels $6, $7 or US 30 tank?
Oil cld break out big time like 2004-05 type
5. US 30 vs Copper
Copper outperformed index 2002 to 2017 being a king metal in real economy
IN historicl perspective, current rally still looks normal, it could well outperform index & hit higher levels $6, $7 or US 30 tank?
10/n
High growth + inflation underway alongside stimulus based recovery, Dr Copper has long way to go
6. Oil vs Copper
Oil always outperformed Copper 2002-2015
From 2014-2021, Oil underperformed.
Both have to intersect or even Oil may outperform.
High growth + inflation underway alongside stimulus based recovery, Dr Copper has long way to go
6. Oil vs Copper
Oil always outperformed Copper 2002-2015
From 2014-2021, Oil underperformed.
Both have to intersect or even Oil may outperform.

11/n
Ominous like Dow vs Oil chart. Will Copper head lower to 3.5 and Oil at 80-100 $ or Will Oil hit 120$
High growth + inflation underway alongside stimulus based recovery, Copper and Crude are FORD and FERRARI of World real economy
Ominous like Dow vs Oil chart. Will Copper head lower to 3.5 and Oil at 80-100 $ or Will Oil hit 120$
High growth + inflation underway alongside stimulus based recovery, Copper and Crude are FORD and FERRARI of World real economy
12/n
7. Dow Gold Ratio vs Nasdaq Gold Ratio (My Fav)
Intersected in 2000 at 40 multipl. In 2021, they are again at intersection at 8 multiple.
Gold hit high of 1920 in 2011 with low multiple of 10 levels. We are at 20 on Dow Gold. Akin in for Nasdaq
chart bullish for Gold.
7. Dow Gold Ratio vs Nasdaq Gold Ratio (My Fav)
Intersected in 2000 at 40 multipl. In 2021, they are again at intersection at 8 multiple.
Gold hit high of 1920 in 2011 with low multiple of 10 levels. We are at 20 on Dow Gold. Akin in for Nasdaq
chart bullish for Gold.

13/n
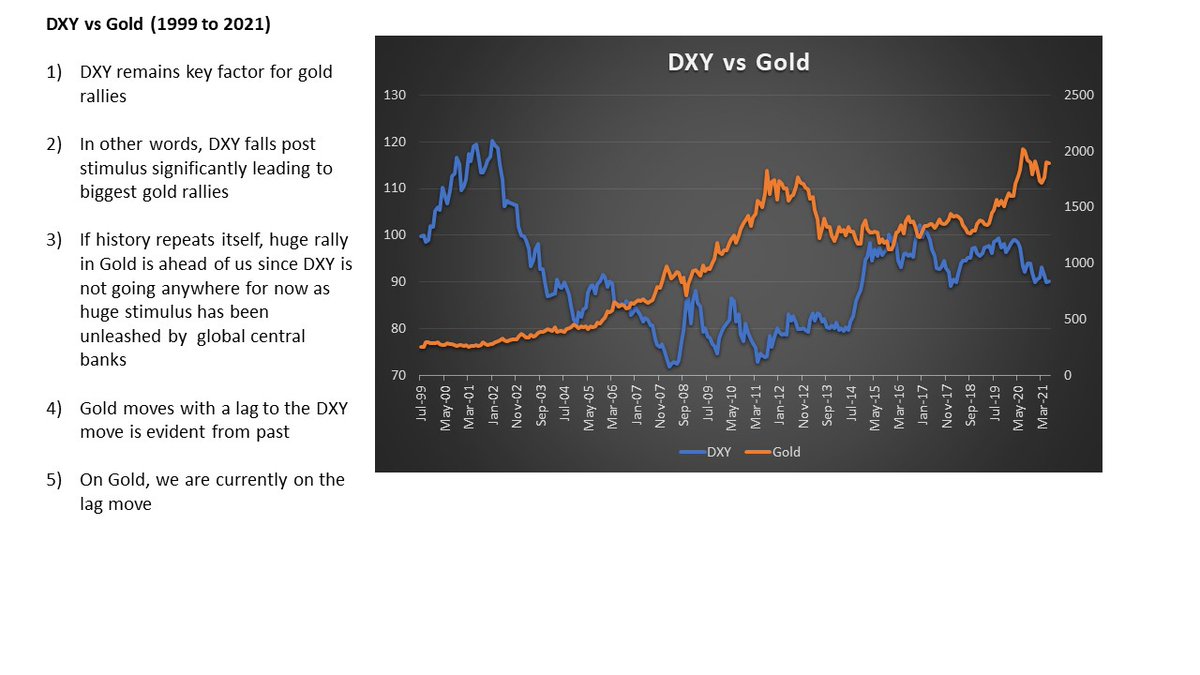
8. DXY vs Gold (My Fav)
DXY remains key factor for gold rallies
In other words, DXY falls post stimulus significantly leading to biggest gold rallies
If history repeats itself, huge rally in Gold is ahead of us since DXY is not going anywhere for now
8. DXY vs Gold (My Fav)
DXY remains key factor for gold rallies
In other words, DXY falls post stimulus significantly leading to biggest gold rallies
If history repeats itself, huge rally in Gold is ahead of us since DXY is not going anywhere for now
14/n
huge stimulus has been unleashed by global central banks
Gold moves with a lag to the DXY move is evident from past
On Gold, we are currently on the lag move
huge stimulus has been unleashed by global central banks
Gold moves with a lag to the DXY move is evident from past
On Gold, we are currently on the lag move
15/n
9. GOLD vs Copper
Copper outperforms Gold in bull markets / Strong economic growth period
Both come in sync routinely
Currently Copper is ahead and gold needs a catch up
Chart says copper will further outperform gold and both look set for much higher levels
9. GOLD vs Copper
Copper outperforms Gold in bull markets / Strong economic growth period
Both come in sync routinely
Currently Copper is ahead and gold needs a catch up
Chart says copper will further outperform gold and both look set for much higher levels

DXY weakening is here to stay as FED is committed to pump until full recovery is done.
16/n
Full Deck gif attached here. Happy to share pdf on DM.
End. Thank you for reading. views welcome.
@DEVENDRACHATUR1 @RakeshPujara1 @mosesharding @Macro_Maniac_ @sunchartist @vinitrahtod @aditya_srimal @meandmarkets @VaradMarkets @Blissful_Man @riteshmjn @charliebilello
Full Deck gif attached here. Happy to share pdf on DM.
End. Thank you for reading. views welcome.
@DEVENDRACHATUR1 @RakeshPujara1 @mosesharding @Macro_Maniac_ @sunchartist @vinitrahtod @aditya_srimal @meandmarkets @VaradMarkets @Blissful_Man @riteshmjn @charliebilello
• • •
Missing some Tweet in this thread? You can try to
force a refresh


