🚨New @CAPolicyLab UI Report🚨
(Me, @alexbellecon, @TillvonWachter, Roozbeh Moghadam & Geoff Schnorr)
For the first time, we are able to analyze the reemployment patterns of UI claimants during the pandemic.
Thread 1 of 2🧵 -->
capolicylab.org/wp-content/upl…
(Me, @alexbellecon, @TillvonWachter, Roozbeh Moghadam & Geoff Schnorr)
For the first time, we are able to analyze the reemployment patterns of UI claimants during the pandemic.
Thread 1 of 2🧵 -->
capolicylab.org/wp-content/upl…

Of the 2 million UI Claimants in CA who were laid off in 2020q2 & experienced a "full separation" from their employers, (i.e., they weren't just working reduced hours), nearly 40% remained totally unemployed (registering $0 in earnings) for the rest of the year.
(Q3 and Q4 2020)
(Q3 and Q4 2020)

45% of UI claimants had been recalled to their prior employer by the end of the year.
Some groups were less likely than others to be recalled, including:
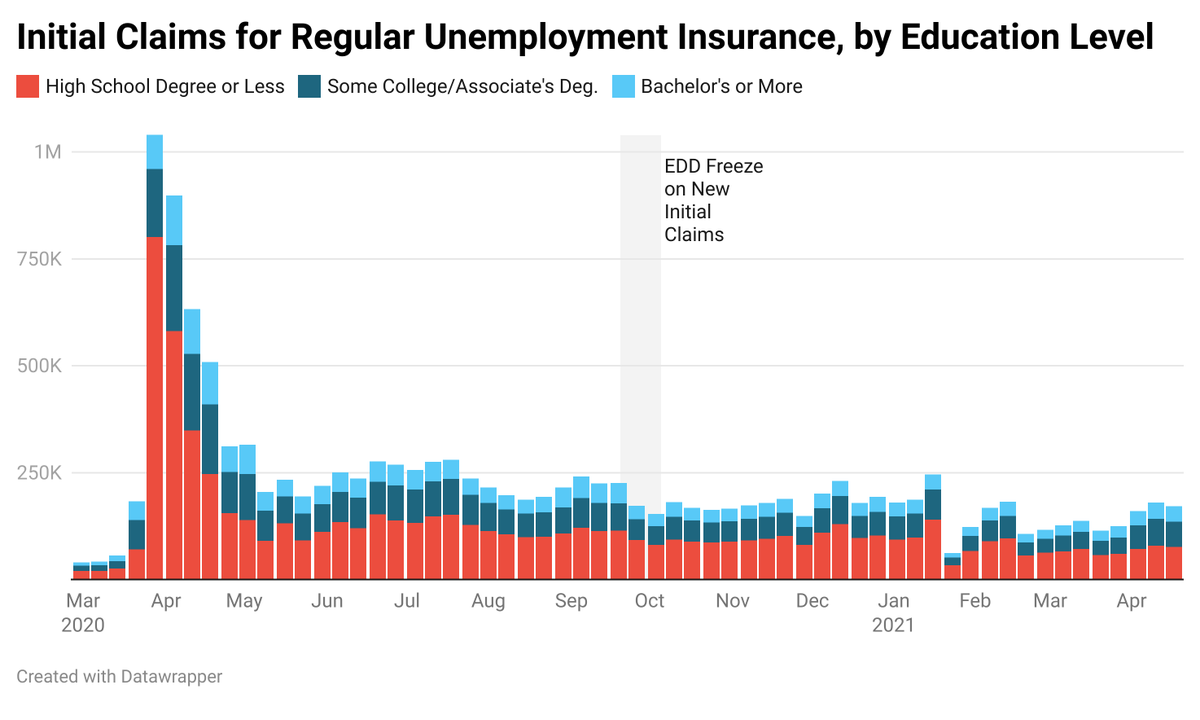
-Lower Educated workers (41%)
-Black workers (37%)
-Younger workers (Gen Z) (40%)
Some groups were less likely than others to be recalled, including:
-Lower Educated workers (41%)
-Black workers (37%)
-Younger workers (Gen Z) (40%)

There are substantial differences in the rate of recall between industries. Workers from Management & Manufacturing saw the highest rates of recall (63%, 64%), while Accommodation & Food Services + the Admin. Support/Waste Mgmt industries saw lower rates of recall. (43%, 35%)

We also shed light on recent trends in the total number of people receiving UI benefits each week.
The total # of Californians receiving regular UI benefits fell by 850,000 people in the Spring, from 2.3m in early March to under 1.5m in May.
What drove this sudden decline?
The total # of Californians receiving regular UI benefits fell by 850,000 people in the Spring, from 2.3m in early March to under 1.5m in May.
What drove this sudden decline?

52 weeks after a claim begins, claimants reach the end of their "benefit year".
Once this happens, they cannot continue receiving payments until they file a new claim- even if they have weeks remaining on their original claim.
edd.ca.gov/about_edd/coro…
Once this happens, they cannot continue receiving payments until they file a new claim- even if they have weeks remaining on their original claim.
edd.ca.gov/about_edd/coro…
We find that in CA, UI claimants are *MUCH* more likely to exit the UI system in the week their benefit year ends.
(Notice the decline in the # of claimants has been heavily concentrated in the PEUC & EB programs- claimants who started their benefit year last Spring.)
(Notice the decline in the # of claimants has been heavily concentrated in the PEUC & EB programs- claimants who started their benefit year last Spring.)

So how big of an issue is the end of a benefit year?
Consider this:
In the 11 weeks between March 13 2021 & May 22nd, (~1 yr after the start of the crisis), 51% of the 850,000-person decline in the # of claimants in CA was due to claimants reaching the end of their benefit year.
Consider this:
In the 11 weeks between March 13 2021 & May 22nd, (~1 yr after the start of the crisis), 51% of the 850,000-person decline in the # of claimants in CA was due to claimants reaching the end of their benefit year.

This issue may not be limited to CA: All states have benefit years which require claimants to file trans'l claims to continue receiving benefits.
W/o access to other states' admin. data, it is unclear how many claimants in other states may have similarly been pushed out of UI.
W/o access to other states' admin. data, it is unclear how many claimants in other states may have similarly been pushed out of UI.
cc #EconTwitter
@p_ganong @keds_economist @ernietedeschi @paulgp @kevinrinz @hshierholz @claudia_sahm @EvermoreMichele @marthagimbel @DanielBZhao @benzipperer @jc_econ @bencasselman @DianeSwonk @aaronsojourner @margotroosevelt @M_C_Klein @sdonnan
@p_ganong @keds_economist @ernietedeschi @paulgp @kevinrinz @hshierholz @claudia_sahm @EvermoreMichele @marthagimbel @DanielBZhao @benzipperer @jc_econ @bencasselman @DianeSwonk @aaronsojourner @margotroosevelt @M_C_Klein @sdonnan
~Bonus thread~ on what's going on with the elevated level of initial claims here:
https://twitter.com/TJ_Hedin/status/1410243009208279042?s=20
• • •
Missing some Tweet in this thread? You can try to
force a refresh