<SUTRA's analysis of third wave> @stellensatz @Ashutos61 @Sandeep_1966 @shekhar_mande It took us a while to do the analysis for three reasons. First, loss of immunity in recovered population. Second, vaccination induced immunity. Each of these two need to be estimated for future.
And third, how to incorporate the two in the model. Fortunately, it turned out that both can be incorporated by suitably changing contact rate and reach parameters. So that takes care of third one. First two required detailed analysis.
We went through the studies done in the past on loss of immunity and used conservative numbers for them. Similarly, we looked at the projected vaccination rate over next few months, included the effects of vaccine-hesitancy, and arrived at month-wise estimates for vaccination.
Then came imponderables. Will there be a new, more infectious, mutant? If yes, when will it strike? When will people abandon caution completely as in March this year? One can only make guesses, which may be completely wrong. Hence, it is better to compute a few what-if scenarios.
We have created three scenarios. One is optimistic one. In this, we assume that life goes back to normal by August, and there is no new mutant. Second is intermediate one. In this we assume that vaccination is 20% less effective in addition to optimistic scenario assumptions.
Third is pessimistic one. This has one assumption different from intermediate one: a new, 25% more infectious mutant spreads in August (it is not delta+, which is not more infectious than delta).
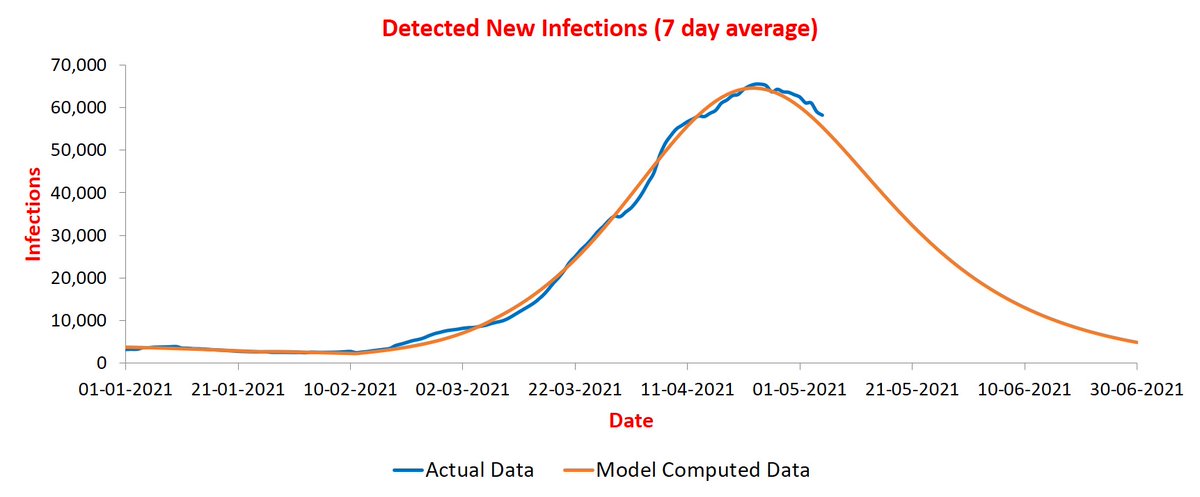
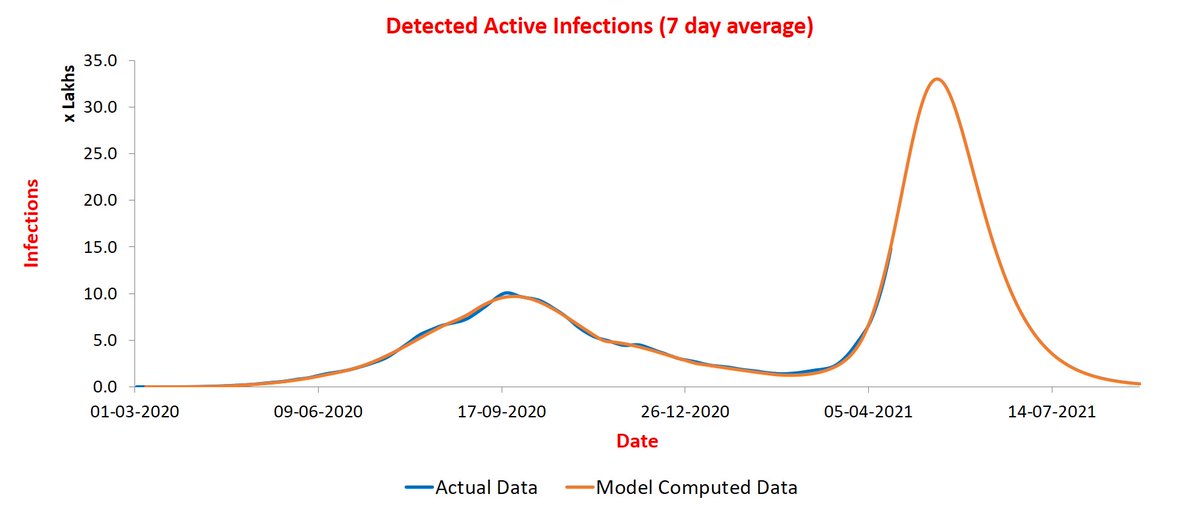
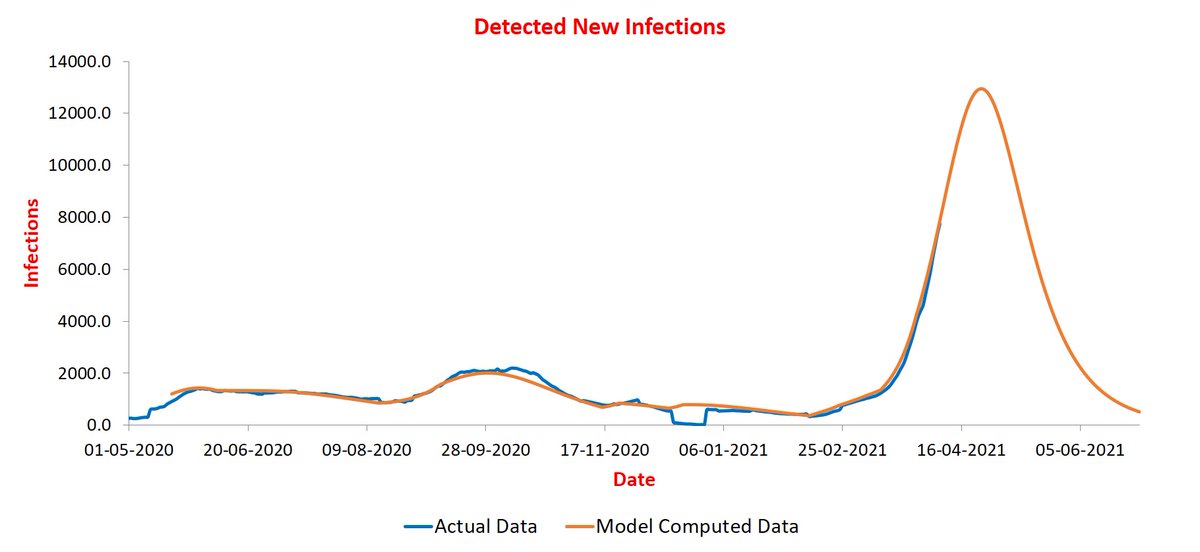
Here are plots for the three scenarios. Blue curve is actual data. Orange one is model prediction until May. Dotted curves are three scenarios plotted from June.
There is hardly any difference between optimistic and intermediate scenarios suggesting vaccine efficacy changes do not have significant impact. A faster spreading mutant has bigger impact as shown by purple curve. Even this is nowhere close to second wave.
So the bottom line is: if there is no significantly faster spreading mutant, third wave will be a ripple. And if there is such a mutant, third wave will be comparable to first one.
However, if there is an immunity-escape mutant, all the above scenarios will be invalid!

• • •

Missing some Tweet in this thread? You can try to force a refresh
 

Keep Current with Manindra Agrawal

Manindra Agrawal Profile picture

Stay in touch and get notified when new unrolls are available from this author!

Read all threads

This Thread may be Removed Anytime!

PDF

Twitter may remove this content at anytime! Save it as PDF for later use!

Try unrolling a thread yourself!

how to unroll video
  1. Follow @ThreadReaderApp to mention us!

  2. From a Twitter thread mention us with a keyword "unroll"
@threadreaderapp unroll

Practice here first or read more on our help page!

More from @agrawalmanindra

17 May
Starting a new thread on analysis of lockdown in various states. First, let us examine UP. The plot for UP and SUTRA projections for it from 1st March are below.
UP went through two phase changes in this period. First started on 15th March with 10 days of drift. In this phase, the contact rate went up to 0.53 (95% CI: +- 0.03) from 0.4. And reach roughly doubled. This double whammy caused sharp rise in infections as is evident.
Next phase change started on 21st April with 12 days of drift. In this phase, contact rate went down to 0.28 (95% CI: +- 0.01) and reach further increased by more than 50%.
Read 13 tweets
6 May
<Update on 6/5> @stellensatz I am finding it increasingly difficult to post updates. Hence, getting a website prepared that will do the job. Hope it will be ready by tomorrow. That will allow me to focus more on discussions.
Many posters have pointed out erroneous predictions done for second wave in early April. I already explained the reasons in India thread. If they do not sound convincing, please pay no attention to our predictions. I am sure there are better things to do!😊
For those, who find some value in our predictions, here are updates. Maharashtra continues its downward journey. Notice that orange curve is fitting better now! It is because I updated the simulation with data up to 5th May. Earlier one was with data up to 24th April.
Read 22 tweets
1 May
@thattai I am glad to see decent language now unlike your earlier posts. I hope you can make this a habit. Your argument, as I understand it, is not that the model went wrong in March, rather that policy makers were misled by it. If yes, your argument is based on flawed premise.
Policy makers do not make decisions based on one input. They collect them from multiple sources. While we did give our feedback to them last month, and it was received graciously, they were skeptical about our predictions. Seemingly they had better inputs. 😊
As for our model, it adopts a very different approach to parameter estimation. An approach that is becoming ubiquitous: use data. If one argues that it needs to be improved, I will readily agree. However, to retire? That is truly bizarre!
Read 6 tweets
23 Apr
I have been asked by many people about details of the SUTRA model. We have a preprint uploaded at arxiv.org/abs/2101.09158. It describes how we compute parameter values and phase changes.
India projections can be found in this thread:
Read 4 tweets
18 Apr
@stellensatz @Ashutos61 @Sandeep_1966 @shekhar_mande Starting a new thread for India. I updated India curve last on 14th with suggested peak at ~190K. Past few days have breached this value massively. This led to a discussion amongst us (me, Prof Sagar, and Gen Kanitkar).
The problem is that parameters of our model for current phase are continuously drifting, and so it is hard to get their value right. We decided to switch to predicting "active" instead of "new" infections. Former is about 10x of latter and hence less prone to fluctuations.
Indeed, it turned out that the trajectories are better matched. See plot below for the entire timeline. Image
Read 29 tweets
8 Apr
@stellensatz @Sandeep_1966 @Ashutos61 @shekhar_mande Starting a separate thread on district level predictions. The predicted trajectories do not match as well as for states because of smaller population.
Let us start with Pune -- it was earlier posted on thread on states. It remains on track to peak during April 12-15 at around 11.5K infections/day. Image
Next Mumbai where infections are increasing quite fast. The rise will continue for another couple of weeks and likely to peak during Apr 21-25 at around 13K infections/day. Image
Read 159 tweets

Did Thread Reader help you today?

Support us! We are indie developers!


This site is made by just two indie developers on a laptop doing marketing, support and development! Read more about the story.

Become a Premium Member ($3/month or $30/year) and get exclusive features!

Become Premium

Too expensive? Make a small donation by buying us coffee ($5) or help with server cost ($10)

Donate via Paypal Become our Patreon

Thank you for your support!

Follow Us on Twitter!

:(