<Update on 6/5> @stellensatz I am finding it increasingly difficult to post updates. Hence, getting a website prepared that will do the job. Hope it will be ready by tomorrow. That will allow me to focus more on discussions.
Many posters have pointed out erroneous predictions done for second wave in early April. I already explained the reasons in India thread. If they do not sound convincing, please pay no attention to our predictions. I am sure there are better things to do!😊
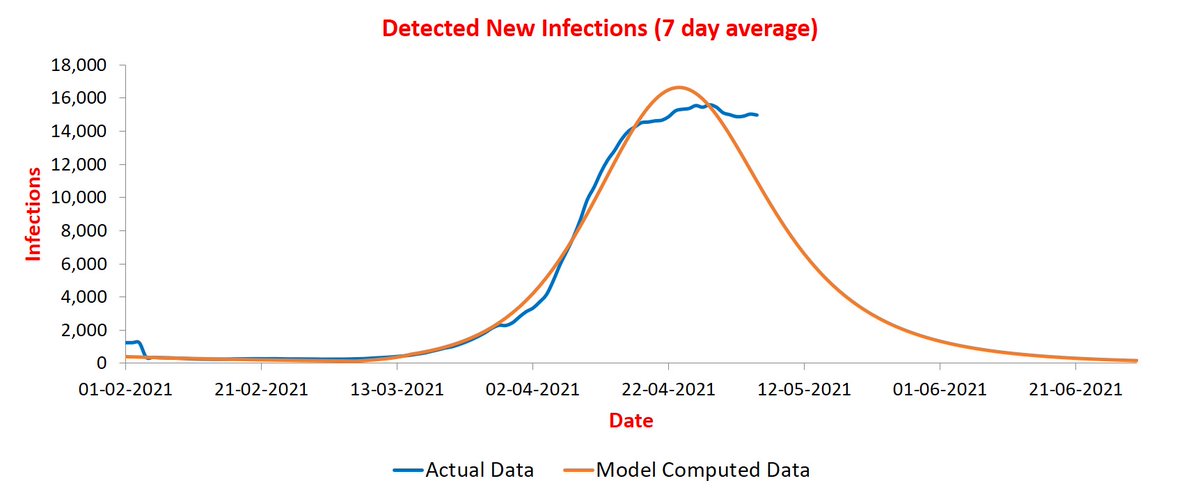
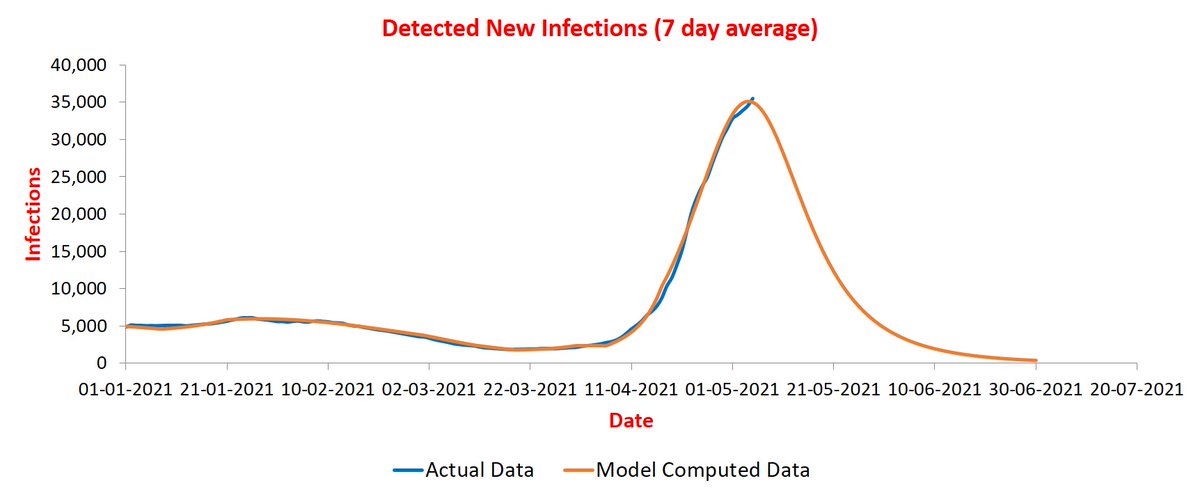
For those, who find some value in our predictions, here are updates. Maharashtra continues its downward journey. Notice that orange curve is fitting better now! It is because I updated the simulation with data up to 5th May. Earlier one was with data up to 24th April.
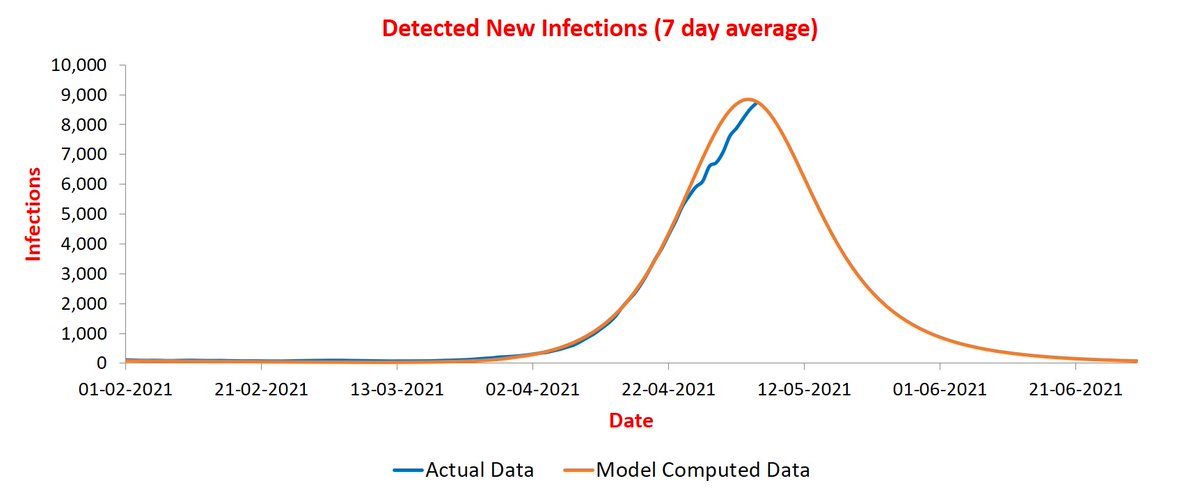
Chhattisgarh continues to hover. It is almost horizontal! This simulation is also updated with up to date data now.
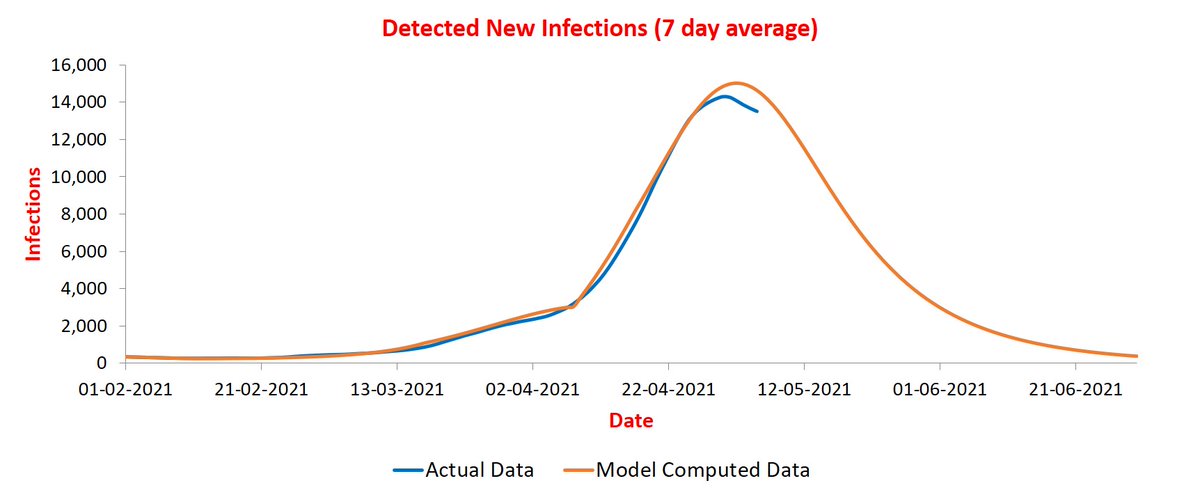
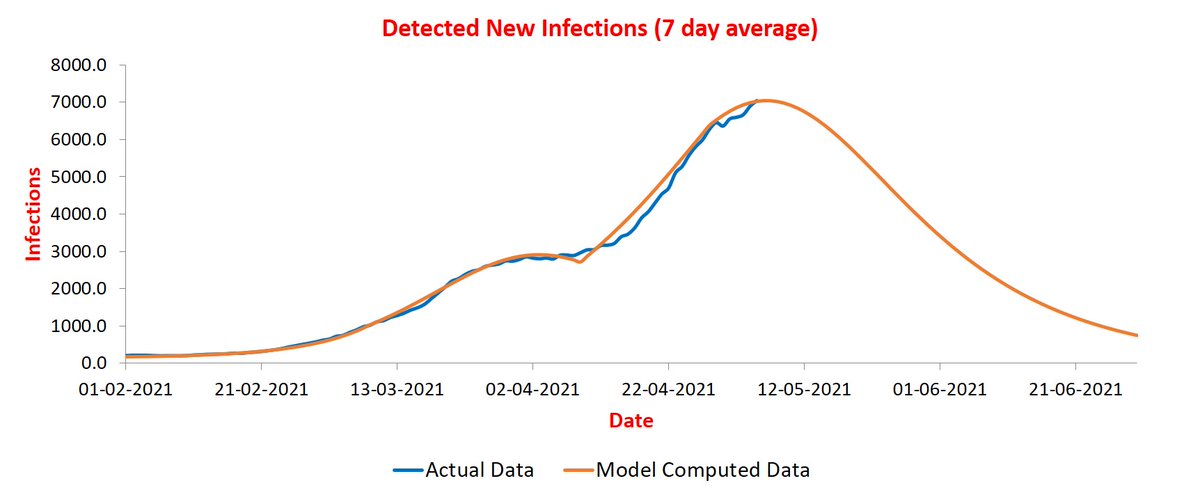
UP is now clearly going down. The slope is slower than predicted though. The simulation is updated as well.
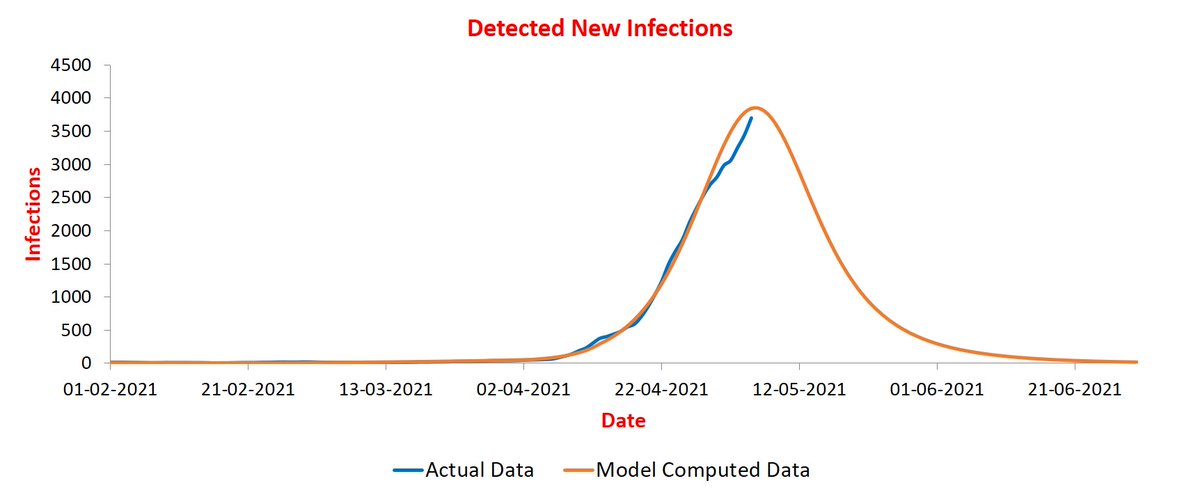
Bihar curve was indeed going through a phase change! It occurred around 24th April. There is barely enough data to capture it with some confidence. More data is required though to get the trajectory right.
Delhi seems on a downward journey now! The mystery of such an early bend is explained, at least in part, by curves of Noida, Ghaziabad, and Gurugram. All are rising well beyond projected peak. It appears many people have moved from Delhi to these cities.
Rajasthan is nearing the peak.
Tamil Nadu curve has finally deviated from predicted trajectory and is peeking out a bit.
Karnataka parameters are stable now. It is likely to peak during May 10-15.
Gujarat has peaked and is on its way down!
So has MP. Although its downward slope is very gentle as of now.
Andhra trajectory required a bit of adjustment. Peak is now during May 10-15.
Haryana has gone beyond the peak! Is it a new phase? Or simply due to Gurugram numbers being increased by migration from Delhi? We will know in a few days.
Jharkhand is oscillating at the peak!
Odisha continues to diverge. It is likely due to lockdown imposed. Need a few more days data to capture it as a new phase.
Telangana has also peaked and is on its way down.
West Bengal is peaking about now.
Kerala also projected to peak about now. It has diverged from the projected trajectory for past two days though.
Adding Assam. Trajectory not fully stabilized yet, but peak does not appear too far.
Adding Uttarakhand. It appears near the peak.
Finally Punjab. It makes a re-entry after several weeks! The phase-shift of early-April has stabilized but not fully. So the predictions are uncertain.

• • •

Missing some Tweet in this thread? You can try to force a refresh
 

Keep Current with Manindra Agrawal

Manindra Agrawal Profile picture

Stay in touch and get notified when new unrolls are available from this author!

Read all threads

This Thread may be Removed Anytime!

PDF

Twitter may remove this content at anytime! Save it as PDF for later use!

Try unrolling a thread yourself!

how to unroll video
  1. Follow @ThreadReaderApp to mention us!

  2. From a Twitter thread mention us with a keyword "unroll"
@threadreaderapp unroll

Practice here first or read more on our help page!

More from @agrawalmanindra

1 May
@thattai I am glad to see decent language now unlike your earlier posts. I hope you can make this a habit. Your argument, as I understand it, is not that the model went wrong in March, rather that policy makers were misled by it. If yes, your argument is based on flawed premise.
Policy makers do not make decisions based on one input. They collect them from multiple sources. While we did give our feedback to them last month, and it was received graciously, they were skeptical about our predictions. Seemingly they had better inputs. 😊
As for our model, it adopts a very different approach to parameter estimation. An approach that is becoming ubiquitous: use data. If one argues that it needs to be improved, I will readily agree. However, to retire? That is truly bizarre!
Read 6 tweets
23 Apr
I have been asked by many people about details of the SUTRA model. We have a preprint uploaded at arxiv.org/abs/2101.09158. It describes how we compute parameter values and phase changes.
India projections can be found in this thread:
Read 4 tweets
18 Apr
@stellensatz @Ashutos61 @Sandeep_1966 @shekhar_mande Starting a new thread for India. I updated India curve last on 14th with suggested peak at ~190K. Past few days have breached this value massively. This led to a discussion amongst us (me, Prof Sagar, and Gen Kanitkar).
The problem is that parameters of our model for current phase are continuously drifting, and so it is hard to get their value right. We decided to switch to predicting "active" instead of "new" infections. Former is about 10x of latter and hence less prone to fluctuations.
Indeed, it turned out that the trajectories are better matched. See plot below for the entire timeline. Image
Read 29 tweets
8 Apr
@stellensatz @Sandeep_1966 @Ashutos61 @shekhar_mande Starting a separate thread on district level predictions. The predicted trajectories do not match as well as for states because of smaller population.
Let us start with Pune -- it was earlier posted on thread on states. It remains on track to peak during April 12-15 at around 11.5K infections/day. Image
Next Mumbai where infections are increasing quite fast. The rise will continue for another couple of weeks and likely to peak during Apr 21-25 at around 13K infections/day. Image
Read 159 tweets
25 Mar
@stellensatz @Ashutos61 @Sandeep_1966 @shekhar_mande This pandemic has a way of embarrassing those making predictions😀. We are indeed in the midst of second wave now. Of course, this wave is being driven primarily by Maharashtra. 1/n
We had to wait for a couple of weeks for the new trajectory to stabilize. Here is what we found: the spike observed in many states is primarily due to a significant increase in contact rate (parameter beta). This parameter determines how fast the pandemic is spreading. 2/n
Consider India. Contact rate has doubled in March (0.24 to 0.48). This results in plot below. The peak is expected to arrive in mid-April at between 70-80K new infections per day. 3/n Image
Read 143 tweets
8 Mar
@stellensatz @shekhar_mande @Ashutos61 @Sandeep_1966 Covid infections are picking up in India again. Interestingly, only a few states are contributing to this spike. Why is this happening? Our model SUTRA provides some clues. 1/n
First, let us look at Maharashtra. In the picture, blue curve is recorded daily new infections (averaged over a window of seven days) and orange curve is prediction of the model. According to the model, the latest spike is due to significant increase in contact rate. 2/n Image
Contact rate represents average number of people infected by an infected person in one day. For Maharashtra, it went from 0.3 to 0.5. The peak should arrive within two weeks. 3/n
Read 9 tweets

Did Thread Reader help you today?

Support us! We are indie developers!


This site is made by just two indie developers on a laptop doing marketing, support and development! Read more about the story.

Become a Premium Member ($3/month or $30/year) and get exclusive features!

Become Premium

Too expensive? Make a small donation by buying us coffee ($5) or help with server cost ($10)

Donate via Paypal Become our Patreon

Thank you for your support!

Follow Us on Twitter!

:(