I haven't been to @SLULAW's building ever! But my office is in the former law library... does that count? I really don't know. 🤷

Anyway. I'm not a lawyer, *but* let's think about this collectively for just a minute... does Webster Groves *have* to admit any group? Image
The most relevant case law here I'm aware of is Hurley v. Irish American Gay, Lesbian, and Bisexual Group of Boston. This allowed the *private* organizers of the Boston St. Patrick's Day parade to exclude groups based on their message because...
... the organizers themselves have a first amendment right to determine the content of the parade (the parade itself is speech). So, if they wanted to discriminate, even if they have been fairly loose with who participated in the past. en.wikipedia.org/wiki/Hurley_v.…
I should note that I find the historic exclusion of LGBTQ organizations from the Boston St. Patrick's Day parade odious. That said, based on the precedent the Hurley case established...
...the very easiest way for a public entity to limit participation in a parade, then, is to turn it over to a private community organization to organize. If the Lions Club in Webster Groves were to take over organizing, they would have wide latitude to determine its composition.
Would this translate to a publicly organized parade? Perhaps not directly, but courts have allowed for "time, place, and manner" restrictions. I would love to hear from some legal experts whether there is room there for a municipality to deny participation in a public parade...
... if there was substantial government interest in keeping the peace (if participants could provoke violence) and/or a public parade had a defined "expressive purpose" - basically a clear theme - as well as clear processes for allowing participants to march in the parade.
If a group could be plausibly seen as detracting from that expressive purpose, and that group could be given alternative arrangements - such as space in a free speech zone - I'm not sure a municipality has to grant them access to the parade.

• • •

Missing some Tweet in this thread? You can try to force a refresh
 

Keep Current with Chris Prener
Chris Prener Profile picture

Stay in touch and get notified when new unrolls are available from this author!

Read all threads

This Thread may be Removed Anytime!

PDF

Twitter may remove this content at anytime! Save it as PDF for later use!

Try unrolling a thread yourself!

how to unroll video
  1. Follow @ThreadReaderApp to mention us!

  2. From a Twitter thread mention us with a keyword "unroll"
@threadreaderapp unroll

Practice here first or read more on our help page!

More from @chrisprener

6 Jul
I’ve updated my #Missouri #COVID19 website for Monday, 7/5 - slu-opengis.github.io/covid_daily_vi…. A few highlights are below 👇.

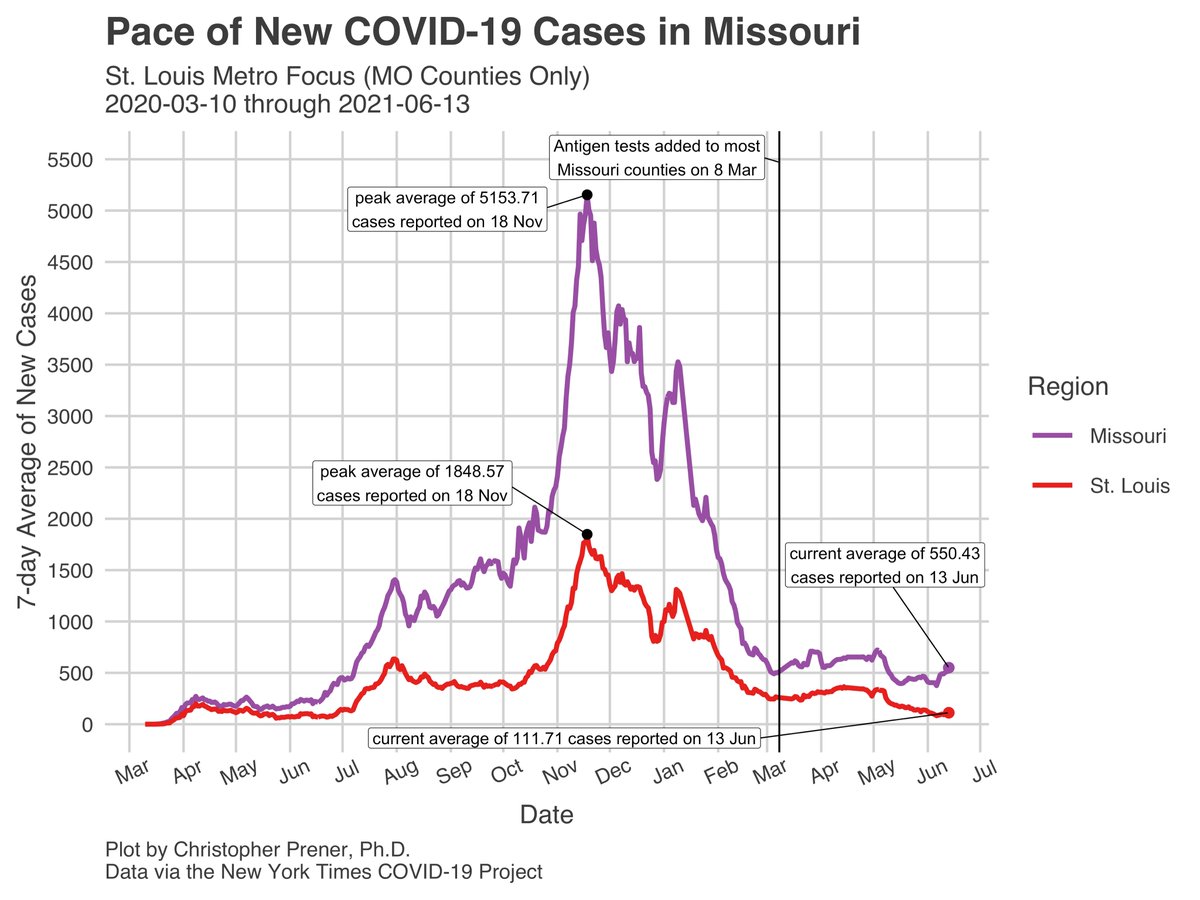
Our statewide 7-day average is headed towards 1,000 new cases per day, with increases in all 3 meso regions. “Outstate” remains most concerning, though. 1/12 ImageImageImageImage
In that broad “outstate” swath, there are now three areas of greatest growth in new cases - NW MO around St. Jo, Mid-MO, and SW MO. Of these, SW MO is by far the most concerning. 2/12 Image
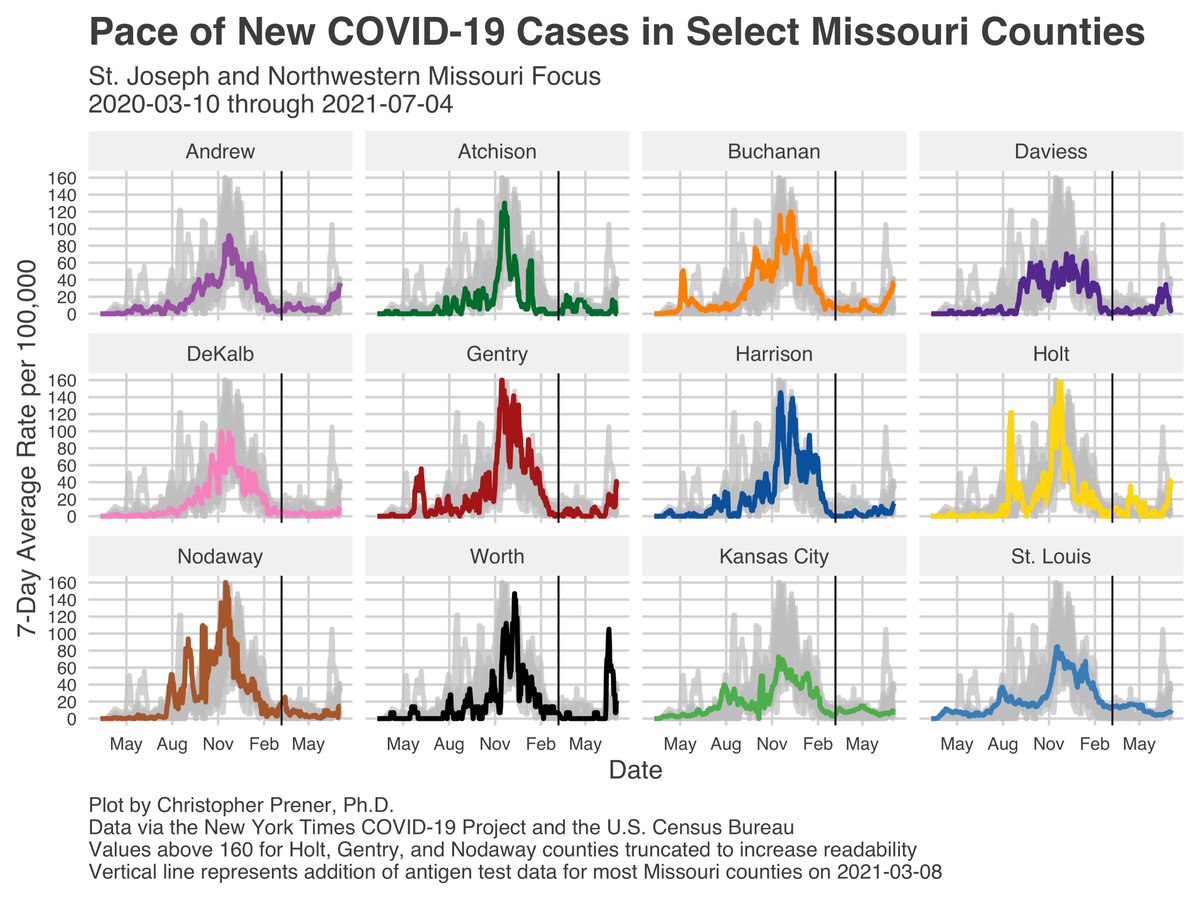
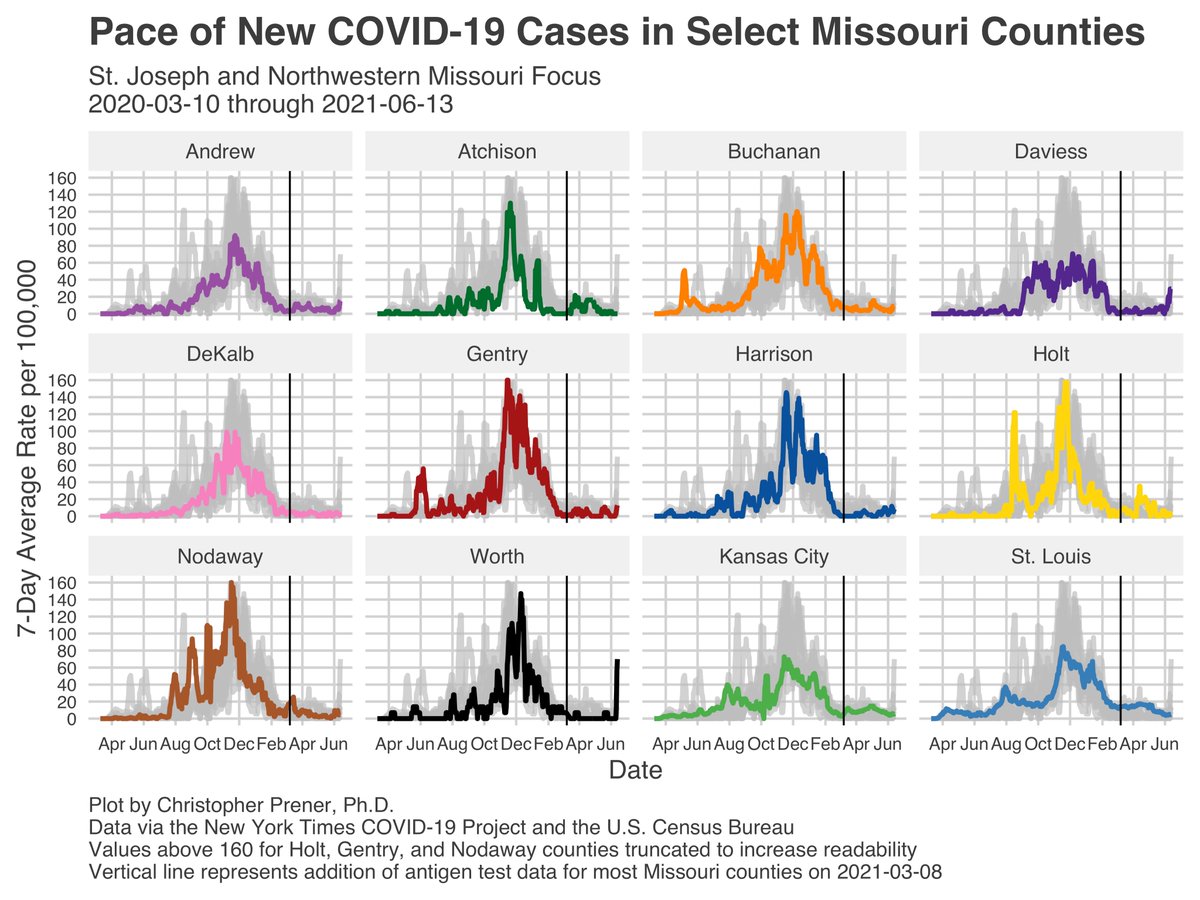
In NW MO, what started in Worth County has spread, with steep increases in Adair, Buchanan, Gentry, and Holt counties. 3/12 ImageImage
Read 12 tweets
20 Jun
I’ve updated my #Missouri #COVID19 website for Saturday, 6/19 - slu-opengis.github.io/covid_daily_vi…. A few highlights are below 👇.

Our statewide 7-day average is now the highest in the United States, and "outstate" is making up 69% of those new cases each day on average.

1/9
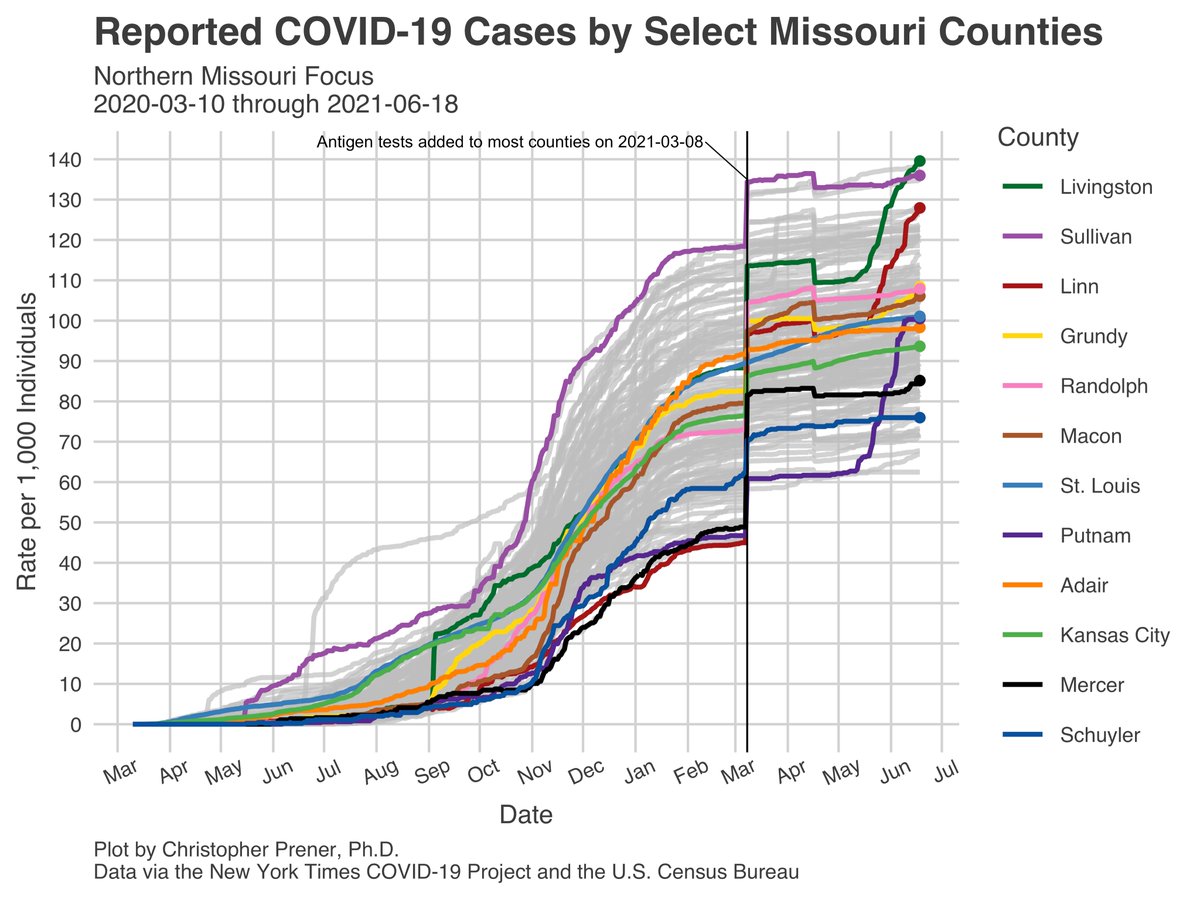
In Northern MO, things are slowly improving in the recently hard-hit trio of Putnam, Linn, and Livingston counties. Linn's 7-day average, however, remains in the top 10 nationwide for counties with more than 10,000 residents. 2/9
I'm concerned about cases shifting from these counties outward, though. Neighboring counties, like Grundy, Macon, and Mercer are worth watching. To the west near St. Jo, Worth County's rate has stopped growing, but there are four other counties showing newly upward trends. 3/9
Read 9 tweets
18 Jun
Look, if you think Sam Page is a dictator, you need to learn about life in actual authoritarian places, because Wildwood ain't one of them.

Let's work through a few things here, though, setting aside the a-historical "dictator" analysis. 1/
First, emergency powers are common in all democracies for dealing with a range of threats, from wars to disasters, terrorist attacks, and pandemics. And there are legitimate critiques we can make of them (see Giorgio Agamben's work, for example). 2/ press.uchicago.edu/Misc/Chicago/0…
But public health emergency orders are established and accepted tools for managing collective crises where "the situation is exigent, the anticipated or potential harm would be calamitous, and the harm cannot be avoided through ordinary procedures." 3/ nejm.org/doi/10.1056/NE…
Read 11 tweets
16 Jun
I’ve updated my #Missouri #COVID19 website for Tuesday, 6/15 - slu-opengis.github.io/covid_daily_vi…. Quite a few highlights are below 👇.

The growth you can see in the statewide 7-day average, placing us tied for no. 3 nationally, is almost entirely from “outstate” MO. 1/17
The two regions I am most concerned remain the same: Northern Missouri and Southwest Missouri. That said, the number of counties in those areas that I'm watching has grown considerably over the past week. 2/17
In Northern MO, Putnam and Livingston counties are seeing their rates fall, but Linn County remains no. 2 nationally (for jurisdictions with more than 10,000 people) because of its rate of new cases. Mercer is a new county to watch as well. 3/17
Read 17 tweets
15 Jun
I’ve fully updated my #Missouri #COVID19 website for Monday, 6/14 - slu-opengis.github.io/covid_daily_vi….

Our 7-day average statewide and in “outstate” Missouri continues to climb. Missouri is currently tied for third (with Utah) in terms of state-level rates of new cases.

1/4 ImageImageImageImage
I’ll give a full update tomorrow, but new counties in both Northern and SW MO are experiencing sharp increases - Chariton and Worth counties, for example, in Northern MO. 2/4 ImageImageImageImage
In #StLouis, rates remain quite low, but we’ve returned to relatively higher rates in North City and North County in particular. 3/4 Image
Read 4 tweets
14 Jun
My #Missouri #COVID19 website has been fully updated for Sunday, 6/13 - slu-opengis.github.io/covid_daily_vi…. As a reminder, I'm doing slightly more frequent threads again since 7-day averages are growing again.

The 7-day averages statewide and “outstate” crept up a bit again yesterday. 1/8 ImageImageImageImage
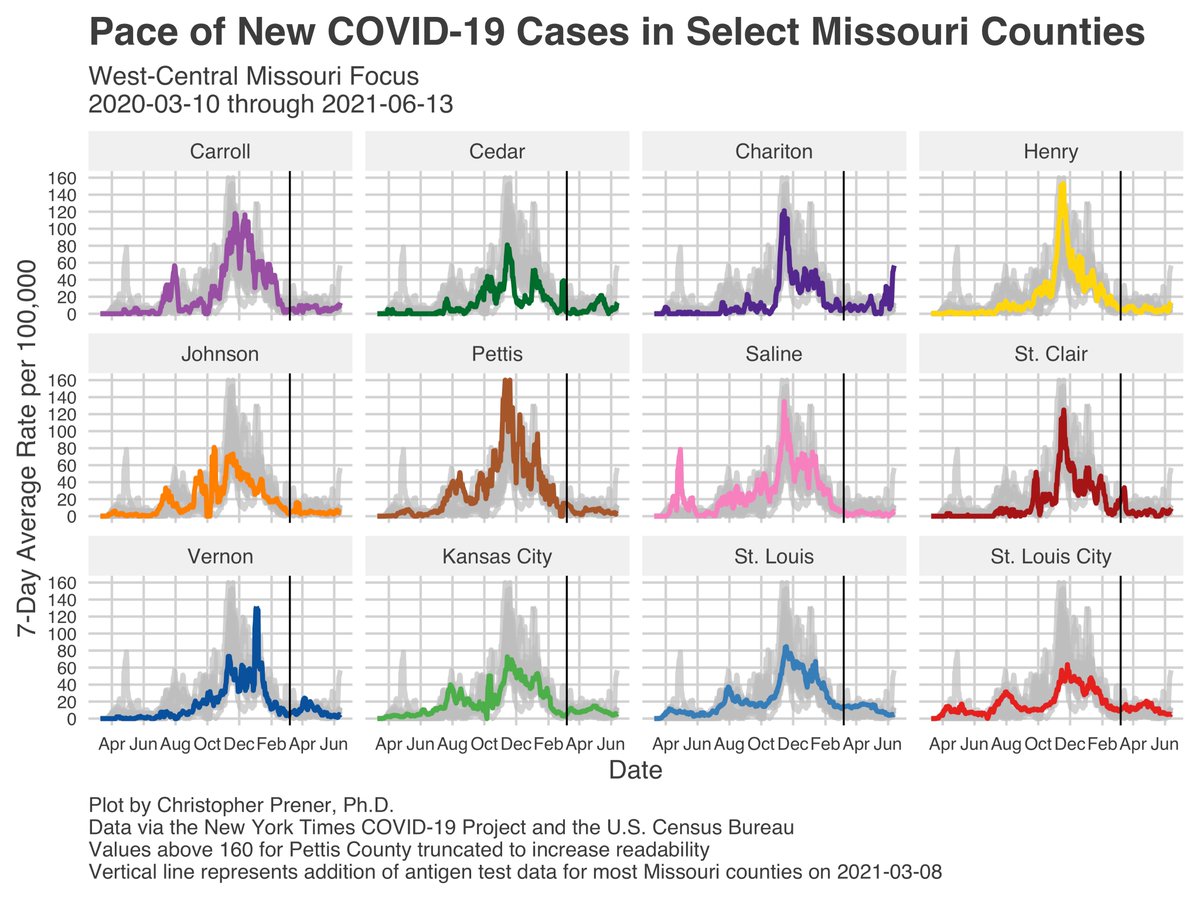
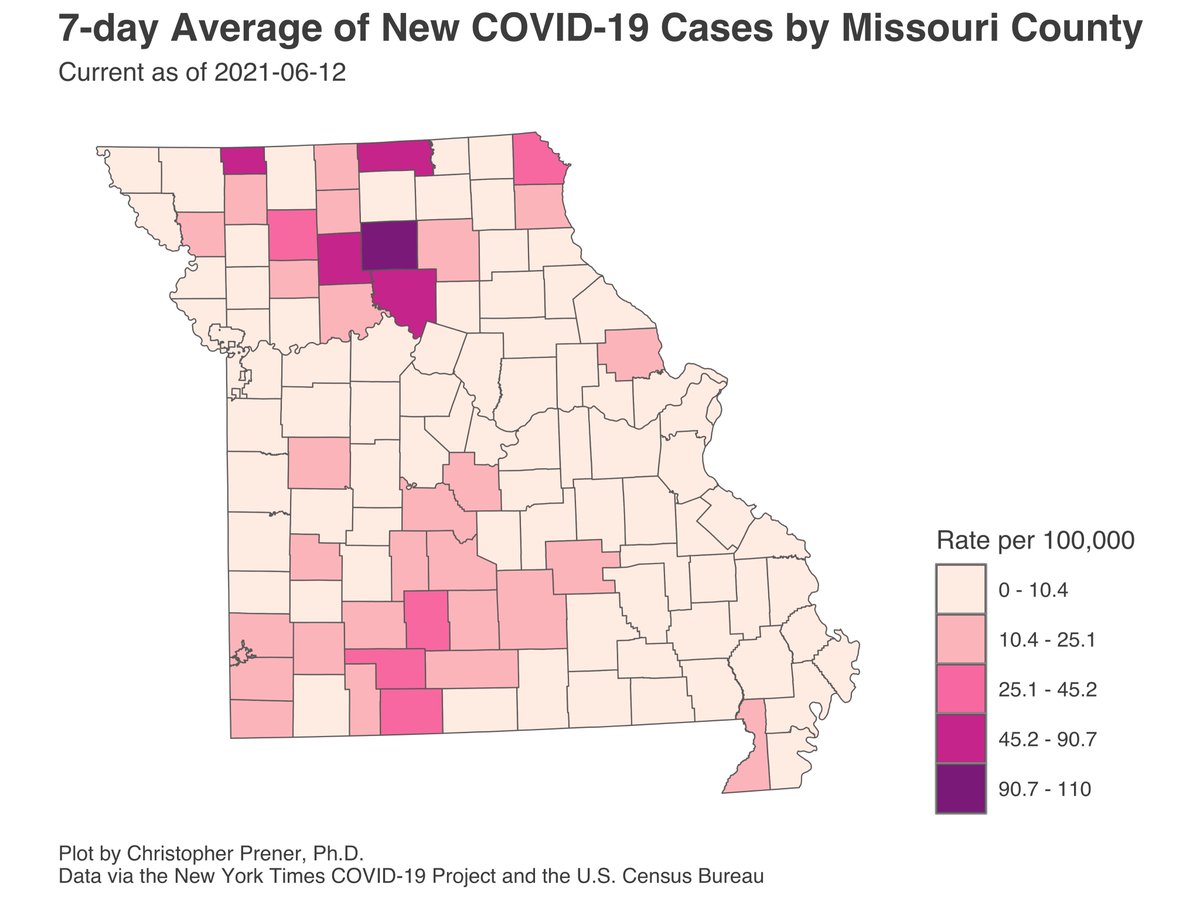
The general areas of concern remain the same - Northern MO and parts of Southwest MO, but the number of counties with concerning trends has grown over the past few days in SW MO in particular. 2/8 Image
In Northern MO, Putnam County’s superlative rates have fallen sharply, as have rates in Linn and Livingston counties. Linn’s rate remains no. 2 nationwide for counties with more than 10,000 residents. 3/8 ImageImageImage
Read 8 tweets

Did Thread Reader help you today?

Support us! We are indie developers!


This site is made by just two indie developers on a laptop doing marketing, support and development! Read more about the story.

Become a Premium Member ($3/month or $30/year) and get exclusive features!

Become Premium

Too expensive? Make a small donation by buying us coffee ($5) or help with server cost ($10)

Donate via Paypal Become our Patreon

Thank you for your support!

Follow Us on Twitter!

:(