travellingtabby.com/scotland-coron…
3,799 new cases reported today, which takes Scotland over the 300,000 mark for the entire pandemic.
Also I've included a thread below covering some of the Scottish figures from the past week! 👇
#covid19scotland #coronavirusscotland #DailyCovidUpdate
3,799 new cases reported today, which takes Scotland over the 300,000 mark for the entire pandemic.
Also I've included a thread below covering some of the Scottish figures from the past week! 👇
#covid19scotland #coronavirusscotland #DailyCovidUpdate
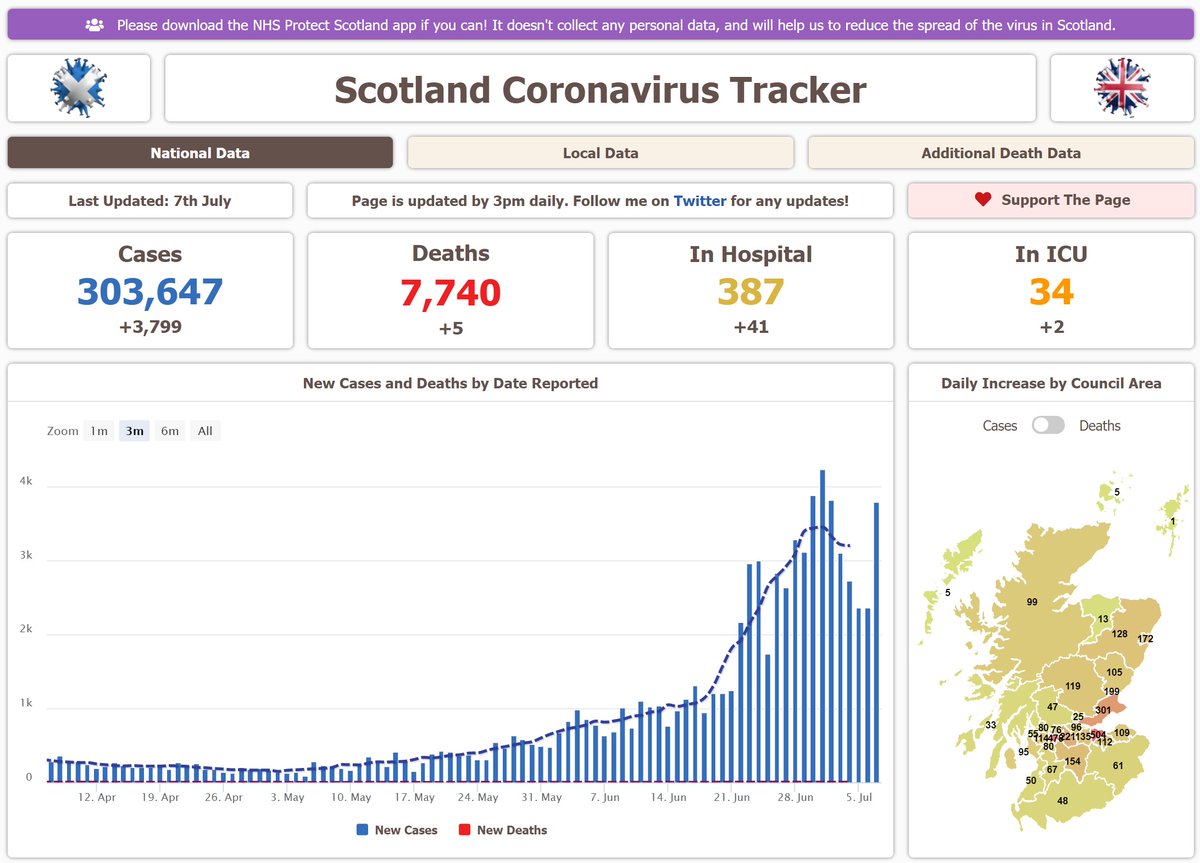


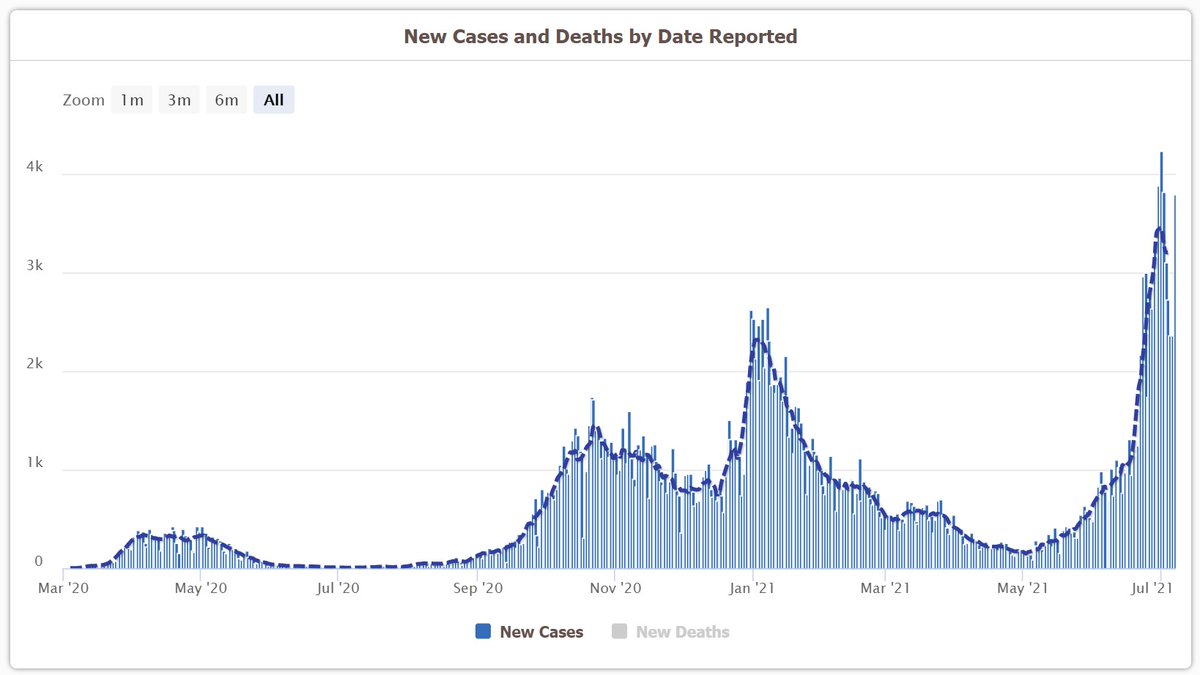
Firstly cases, which appear to be peaking right now!
Still early days of course, but it will be nice if this is the case. We should probably give it to the end of the week to be sure though.
Still early days of course, but it will be nice if this is the case. We should probably give it to the end of the week to be sure though.


If you were wondering how those 300,000 cases stack up against similar sized countries, then here is this. (Although these are yesterdays figures, and they don't take testing differences into account!)


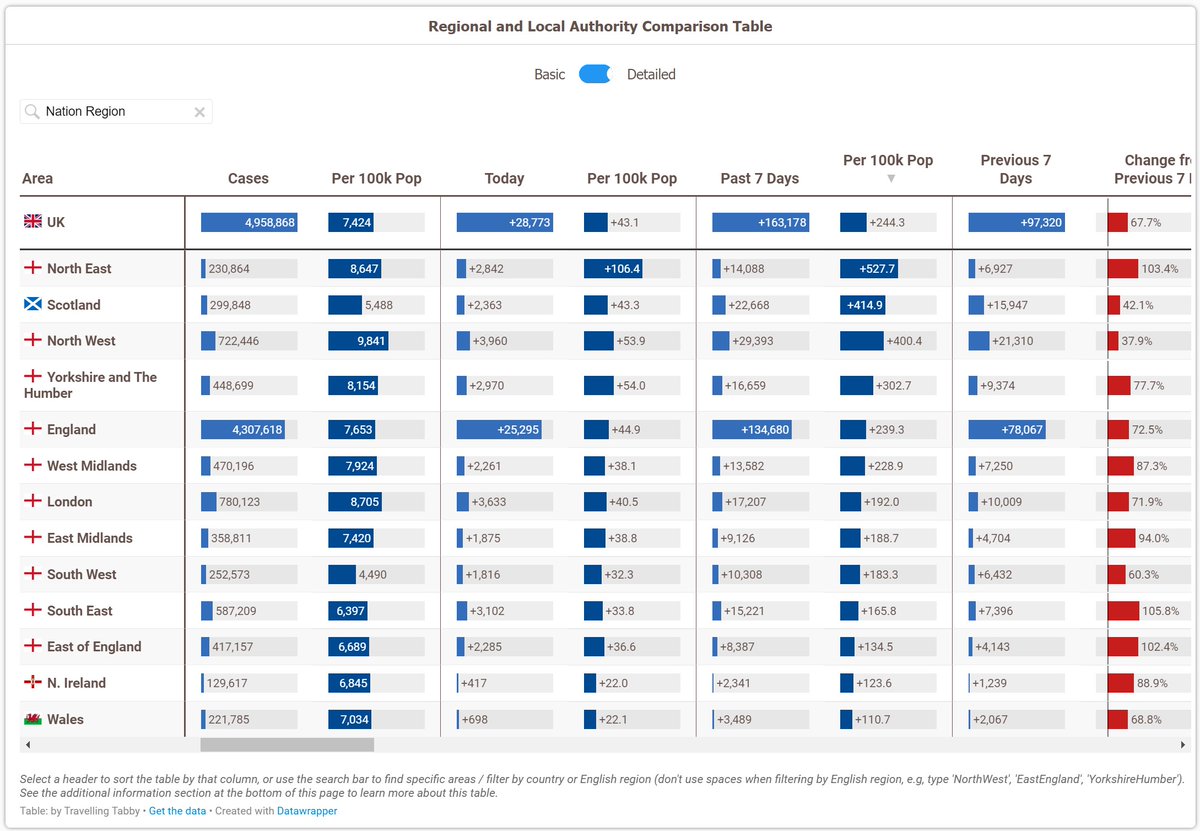
Locally, Dundee are still having the most cases, per capita. Although the rate of growth has slowed down quite a bit
Most areas are still seeing an increase, but generally under a 30% increase. Each day that number gets smaller, and more areas move into the decrease zone!
Most areas are still seeing an increase, but generally under a 30% increase. Each day that number gets smaller, and more areas move into the decrease zone!


Testing has dropped a little in the past week, however the positivity rate has also stopped increasing. At least for now.
Although the 7 day positivity rate is still over 10%, which isn't good. Dundee still has the highest 7 day positivity rate, at 17.5%
Although the 7 day positivity rate is still over 10%, which isn't good. Dundee still has the highest 7 day positivity rate, at 17.5%


Deaths have started to increase a little again, although they are still at a very low rate, especially in comparison to cases.


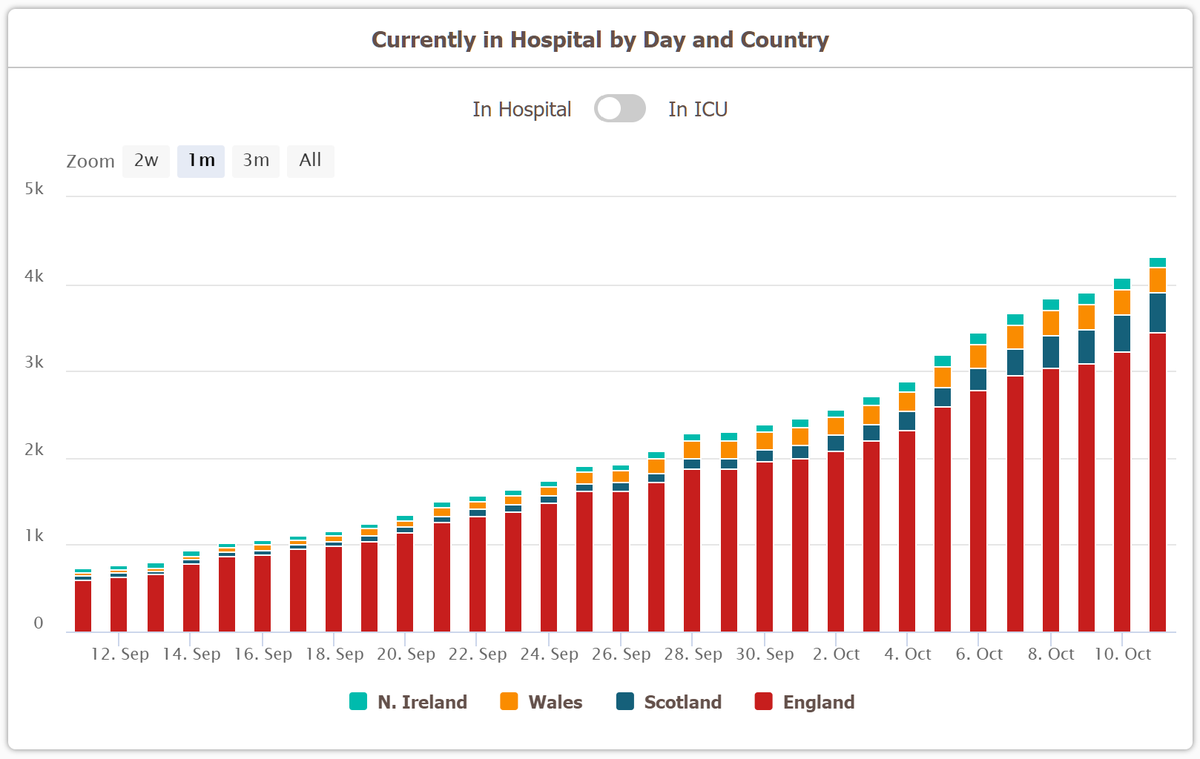
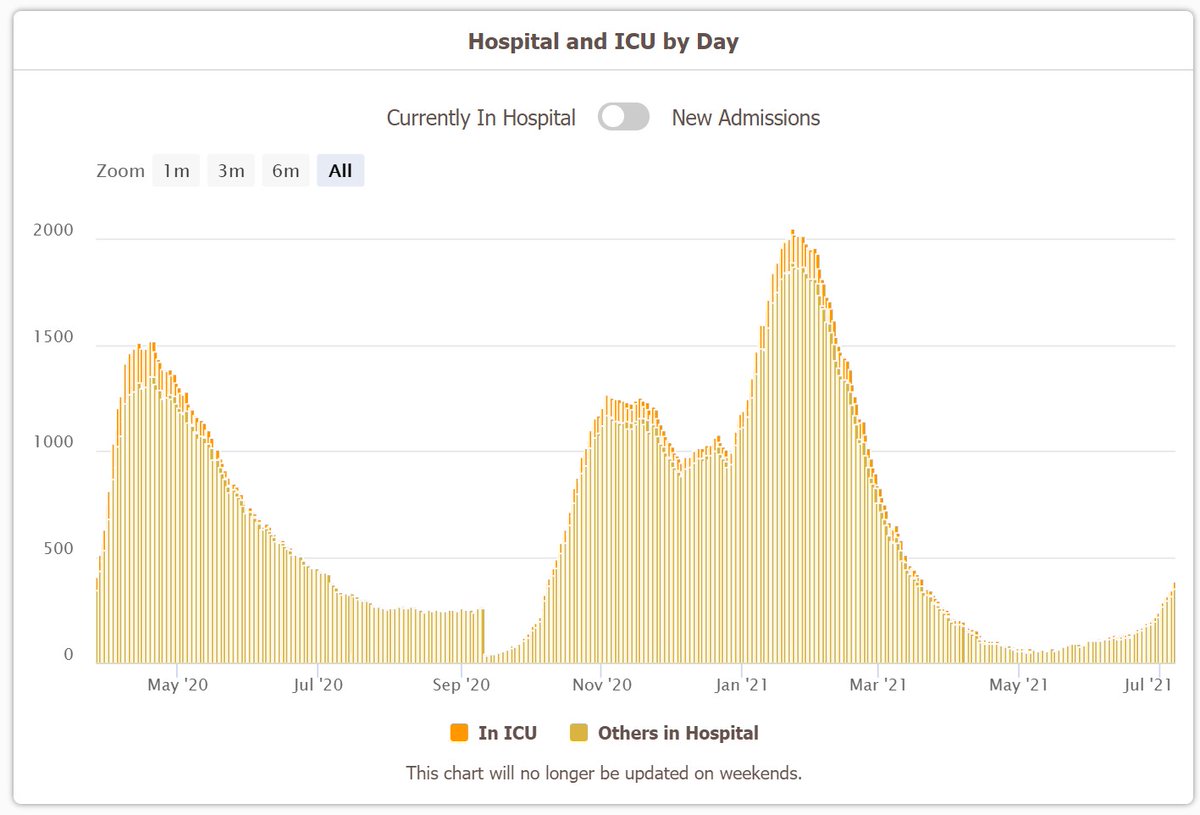
The number of people currently in hospital / ICU with the virus is still increasing, and the rate of increase has sped up quite a bit over the past week.
Of course the numbers are still small in comparison to how they were in January, but they are getting larger most days now.
Of course the numbers are still small in comparison to how they were in January, but they are getting larger most days now.


Here are the current inpatient figures by health board too

Admission figures are in pretty much the same situation as the currently in hospital figures.
The number of people admitted to ICU shot up quite a bit in the past week, after remaining relatively stable over the past month. Hopefully just a blip though
The number of people admitted to ICU shot up quite a bit in the past week, after remaining relatively stable over the past month. Hopefully just a blip though

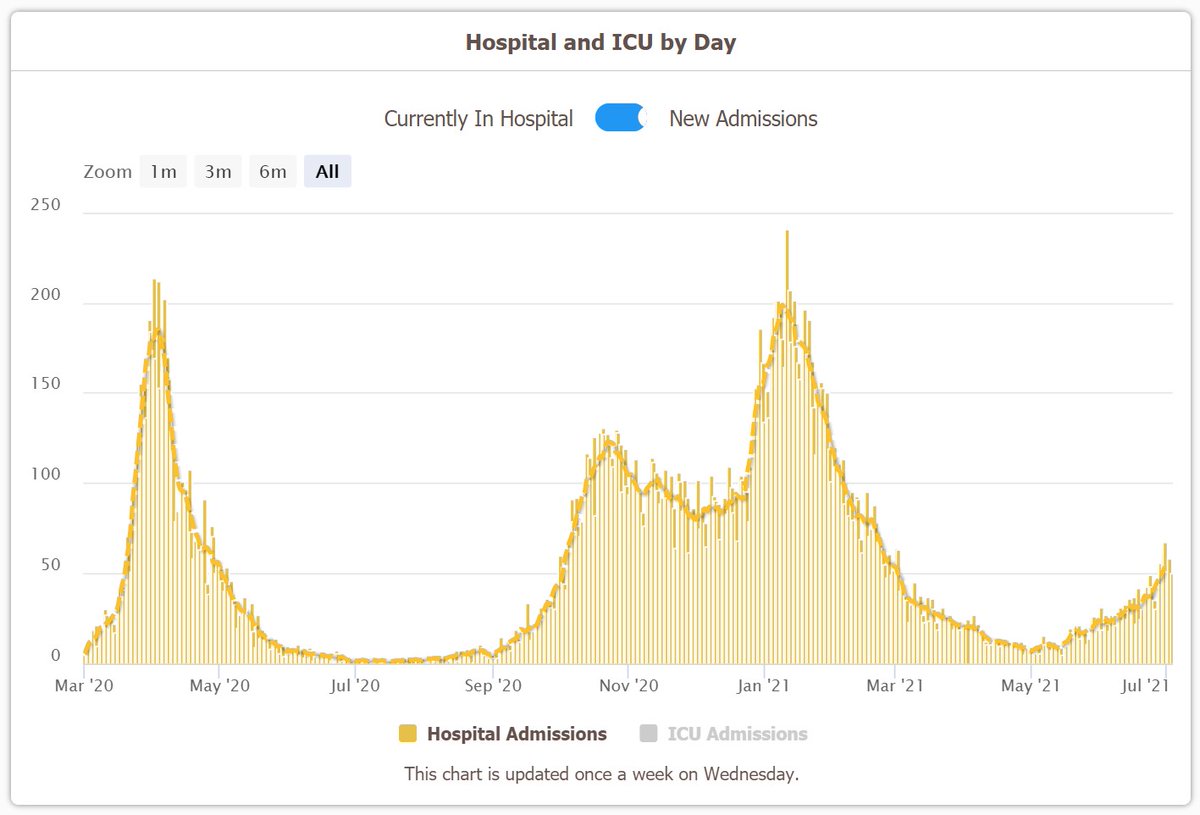


Here is an update to this chart!
Of course it is good that admissions haven't followed cases as closely this time.. although this is still what we were warned about.
A small percentage of cases requiring hospital admission becomes a fairly large number when cases get so high
Of course it is good that admissions haven't followed cases as closely this time.. although this is still what we were warned about.
A small percentage of cases requiring hospital admission becomes a fairly large number when cases get so high

I'm also working on this chart right now.. which is the same as the above one, but with deaths and a few other metrics included, all on their own scales.
I'm hoping to add it to the page soonish!
I'm hoping to add it to the page soonish!


Here are some other hospital admission figures from the weekly PHS report, showing admissions by age group and vaccination status


I also thought I'd share these from the PHS education/young people dashboard (scotland.shinyapps.io/phs-covid19-ed…), which show hospital admissions are at the highest they've ever been for young people.
Although its not surprising when you consider the case rates and lack of vaccines here
Although its not surprising when you consider the case rates and lack of vaccines here


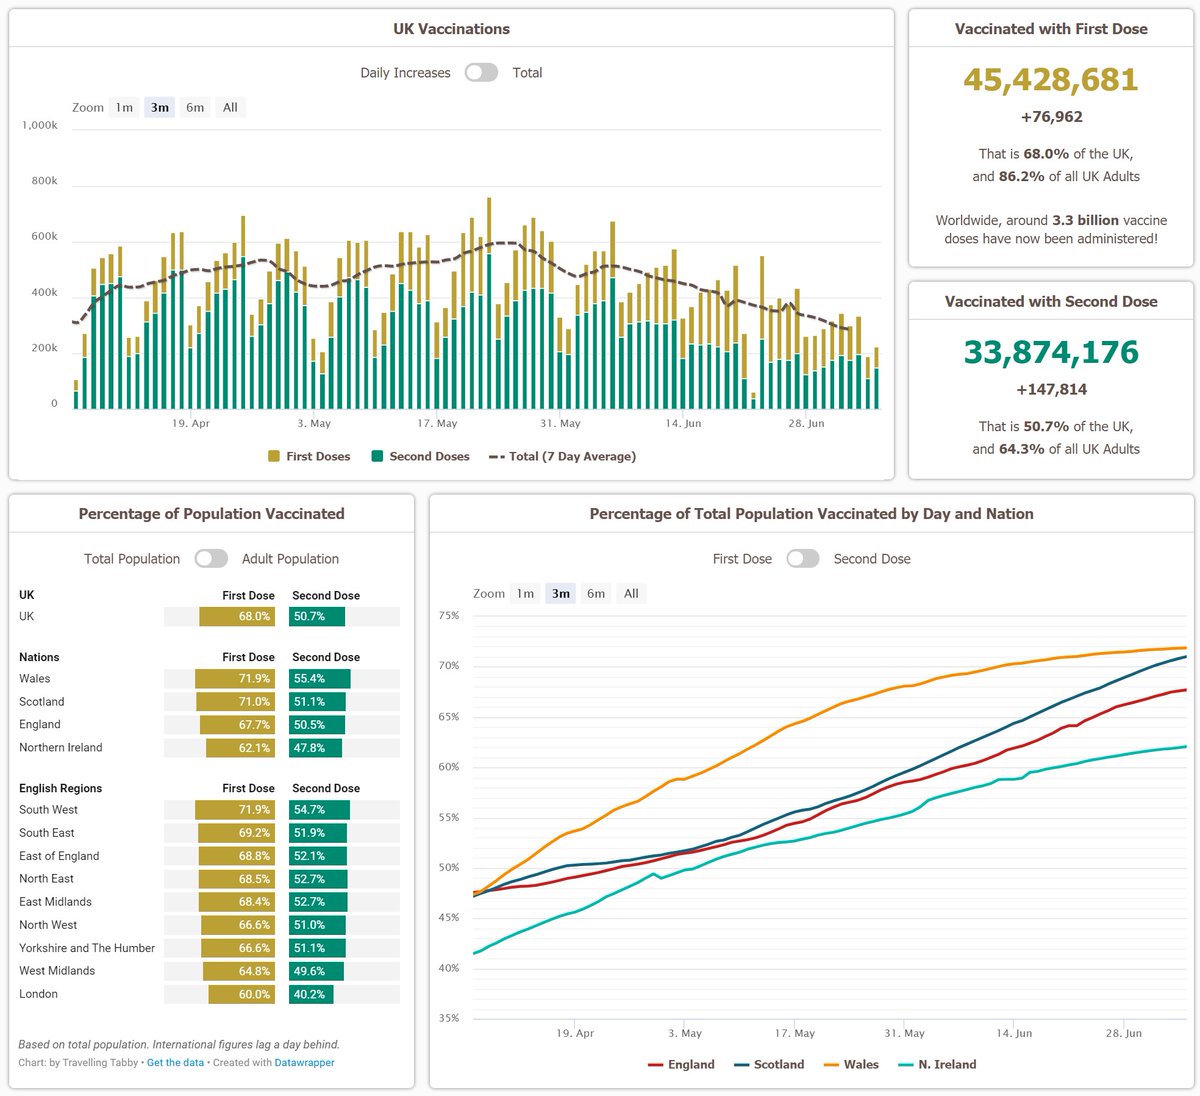
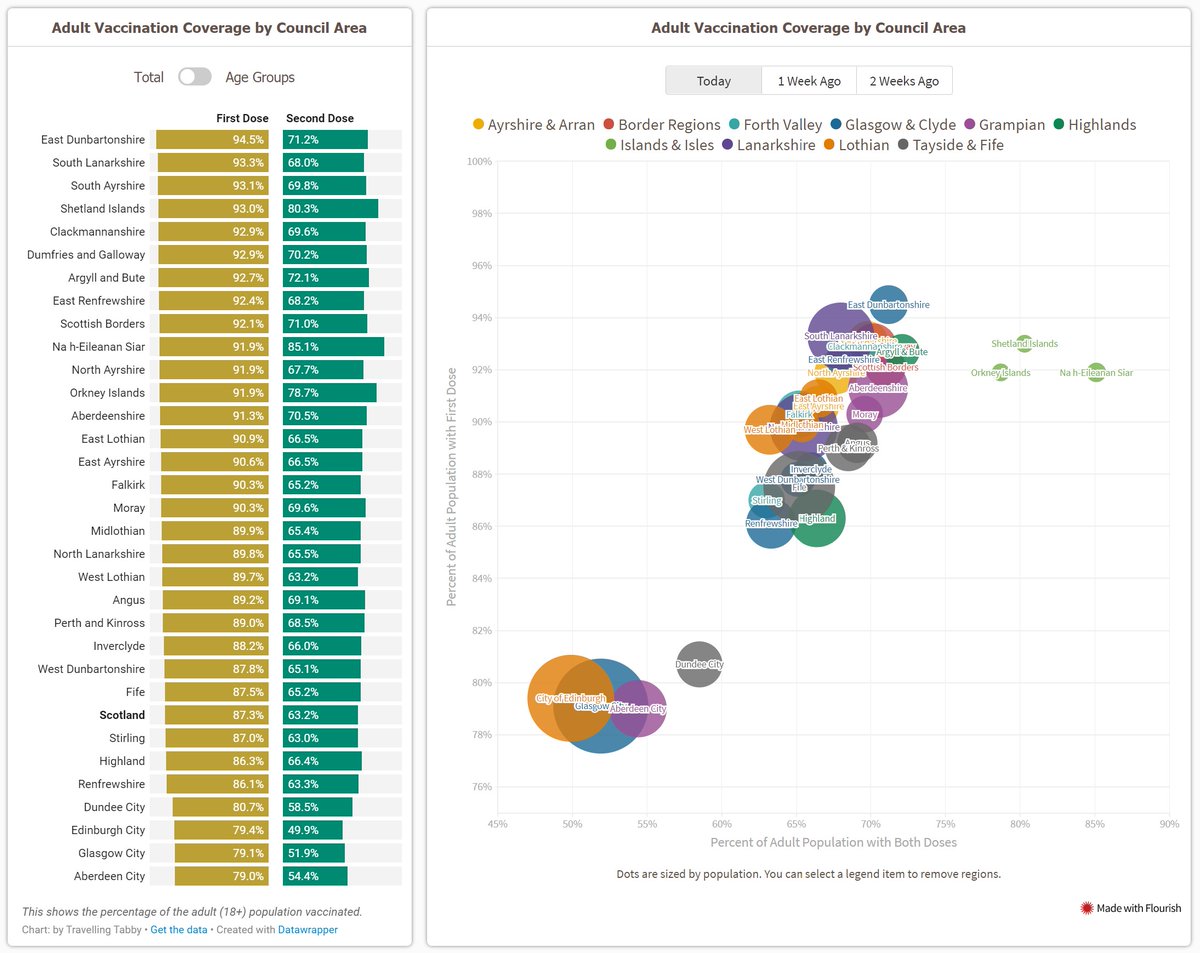
Speaking of vaccinations, here are some figures on them! The overall decreases have slowed down now, which is good to see.
The next milestones to look forward to would be 90% of all adults having their first dose, and 66% (two thirds) of all adults having their second dose
The next milestones to look forward to would be 90% of all adults having their first dose, and 66% (two thirds) of all adults having their second dose
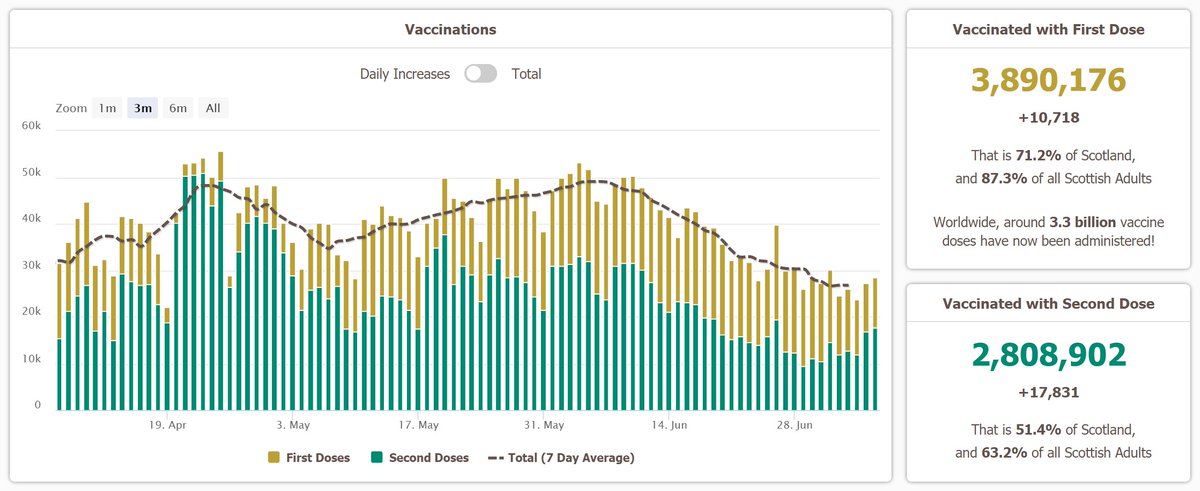


Unfortunately first doses have slowed down quite a bit over the past week. I guess we are just starting to run out of people to vaccinate...
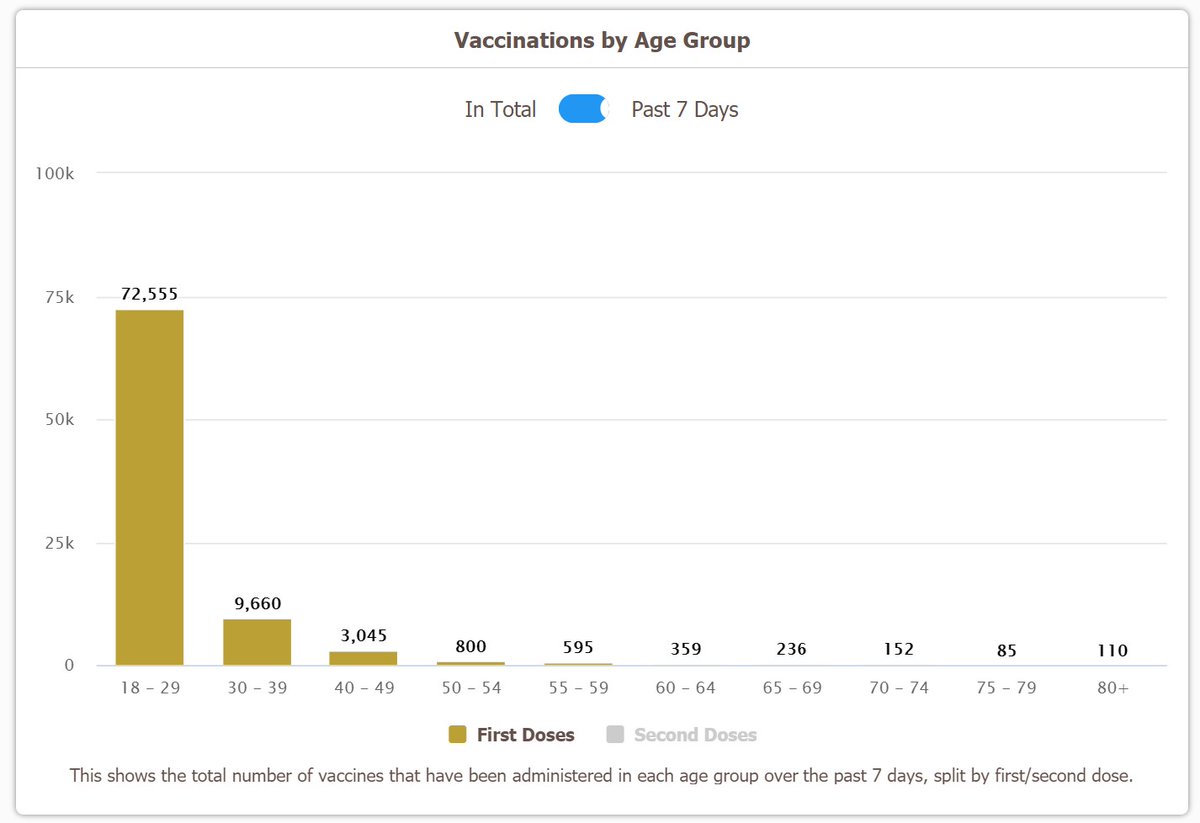
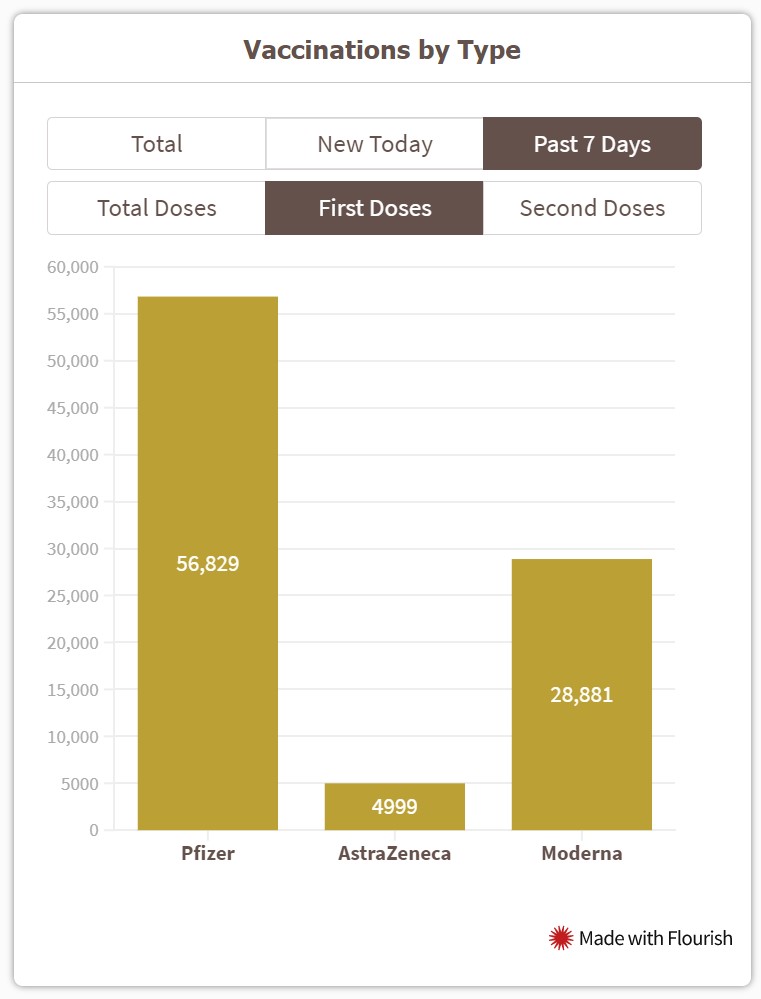
The vast majority of recent vaccinations here have been in the 18-29 range, and the doses are nearly all Pfizer/Moderna
The vast majority of recent vaccinations here have been in the 18-29 range, and the doses are nearly all Pfizer/Moderna


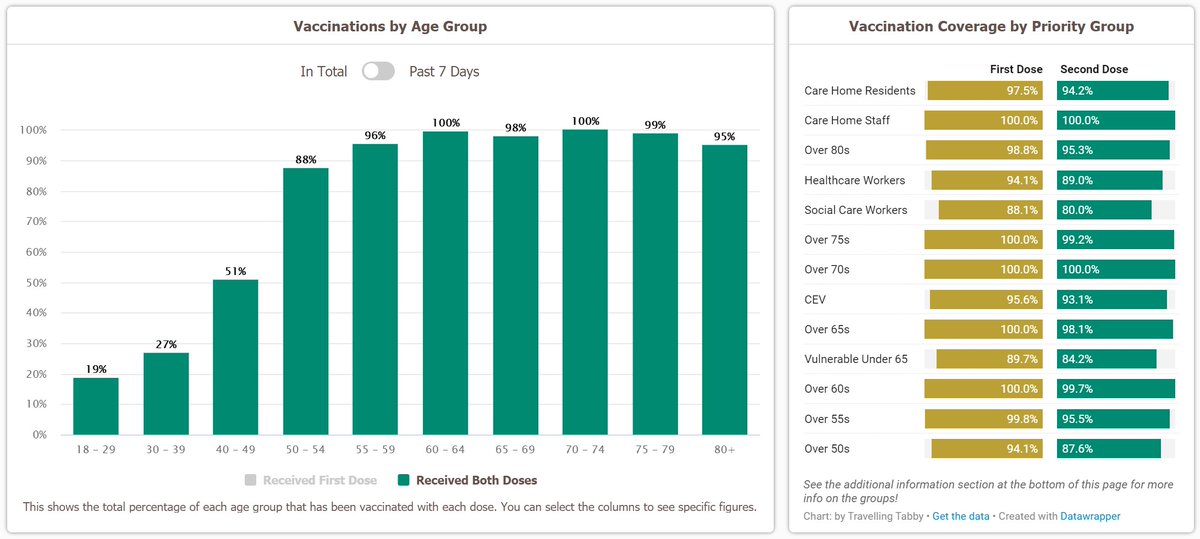
On the otherhand, second doses have started to spike a little again!
Right now the main focus appears to be in the 40-49 age range, and the vaccines are split fairly evenly between Pfizer and Moderna
Right now the main focus appears to be in the 40-49 age range, and the vaccines are split fairly evenly between Pfizer and Moderna


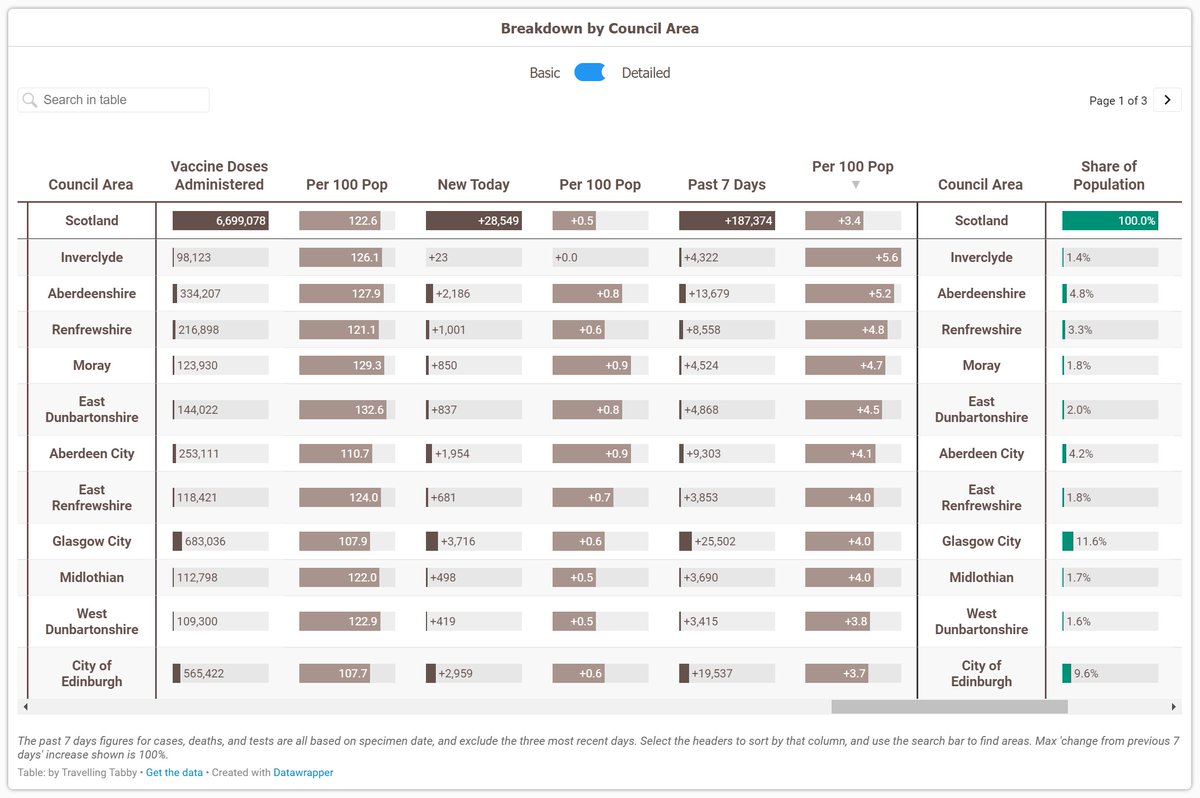
Locally Inverclyde has been administering the most over the past week, per capita.
We're starting to see most areas outside of the cities and islands sort of all huddle up into a big group now with similar coverage figures, as you'd expect to happen over time.
We're starting to see most areas outside of the cities and islands sort of all huddle up into a big group now with similar coverage figures, as you'd expect to happen over time.


And lastly here are the weekly NRS death figures.
There were 21 new deaths reported this week, which is up for the third week in a row, although not by too much.
There were 21 new deaths reported this week, which is up for the third week in a row, although not by too much.


Excess deaths were up a little too, and in the positive for the sixth week in a row. They were actually outside of the normal range this week, although not by too much.

Anyways that is all for now!
Great news that cases appear to hopefully be peaking, and that deaths are still staying low in comparison to cases and hospital admissions.
But the number of hospital admissions and cases we are seeing is still unfortunate
Great news that cases appear to hopefully be peaking, and that deaths are still staying low in comparison to cases and hospital admissions.
But the number of hospital admissions and cases we are seeing is still unfortunate
nhshighland.scot.nhs.uk/News/Pages/Cur…
This from NHS Highland was worrying to read. They are struggling to cope because so many staff are self isolating, general demand is rising, and covid admissions are rising in the area too 😞
This from NHS Highland was worrying to read. They are struggling to cope because so many staff are self isolating, general demand is rising, and covid admissions are rising in the area too 😞
Maybe I'm wrong, but from my experience it seems like most hospitals weren't exactly coping too well in pre-covid times anyways.
Seems like they were always overworked, understaffed, and were generally being made to push the boundaries of what they had capacity to.
Seems like they were always overworked, understaffed, and were generally being made to push the boundaries of what they had capacity to.
Now we're asking them to get back to that, plus deal with the massive covid backlog, plus deal with the rising number of admissions we're seeing, plus deal with the numerous staff members self isolating for 10 days.
All while they're probably exhausted after the past 14 months
All while they're probably exhausted after the past 14 months
I think we all need to really up the number of claps we are sending them!! 👏👏👏👏
But really, I hope they are all doing okay and measures are being put in place to support them. Maybe I'm just worrying too much and most of the NHS is coping with the situation fine.
But really, I hope they are all doing okay and measures are being put in place to support them. Maybe I'm just worrying too much and most of the NHS is coping with the situation fine.
• • •
Missing some Tweet in this thread? You can try to
force a refresh