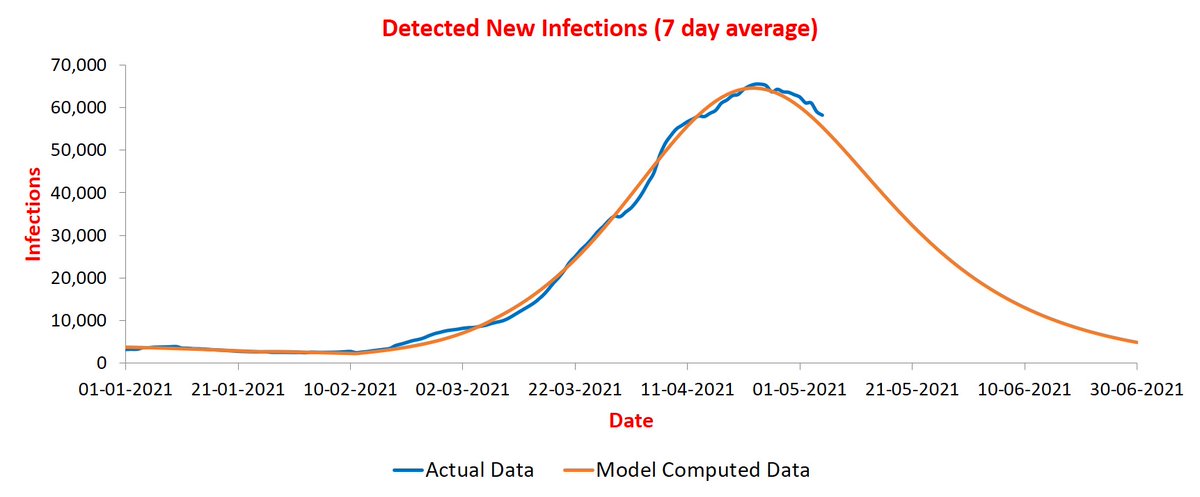
@stellensatz Starting a new thread on states where infections are not coming down as expected, leading to apprehensions about a third wave. Let us see Kerala first. As one can see, the numbers were coming down nicely until mid-June, but then plateaued and now are rising. 

Current phase plot for Kerala shows continuous drifting. The points are turning, which indicates that stability is still far off. What is causing this? Parameter estimates, admittedly imprecise due to drift, show that contact rate is not high, but reach has increased by 25%.
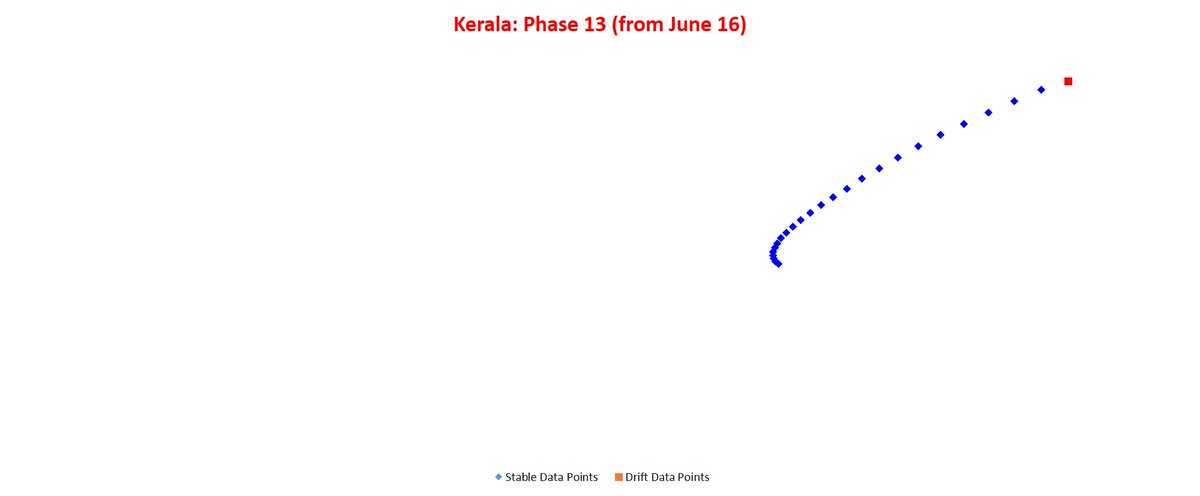
It could be due to either pandemic expanding to newer regions, or a new mutant that is bypassing existing immunity to a significant extent. Genome sequencing done in Kerala has not thrown any such new mutant so far. So it is likely to be former, which is good news!
Now Maharashtra. It also underwent a phase change in mid-June and since then has plateaued.

Current phase plot shows points traversing on a line, but this line does not pass through origin. This indicates a slow drift. However, it is nowhere close to sharp drift in Kerala and so one hopes it will stabilize soon.

Parameters estimated for the current phase show no change in contact rate and about 20% increase in reach. Genome sequencing has not found any new variant here as well.
Finally Manipur. A sharp rise is observed from 21st June and the model is unable to capture it fully yet. Phase plot is showing some signs of stabilizing.

Estimates done for parameters of current phase show something interesting. While reach has increased by 15%, contact rate has reduced by 10%! Then what is causing the sharp rise in cases? It is epsilon! It has gone up by 20%!
These estimates need to be taken with a pinch of salt due to phase not stabilizing yet. If they are close to actual values, it means that there is no real rise. Just that fewer cases are undetected. It is backed by the fact that in June, large scale testing was carried out.
Kerala continues to drift. I had suggested two weeks ago that the rise is Kerala is being fueled by expansion of reach. With the ICMR serosurvey showing ~48% seropositivity for Kerala in June, the model can be calibrated and more precise projections done.
Reach of pandemic by mid-June was ~65%. It means that ~35% population was untouched by pandemic. Since then reach has been increasing and is above 90% now. As phase plot has not stabilized, this may change. However, it is clear that reach has gone up significantly in past month.
At present, ~51% population is immune and there is much room to grow. Pandemic is unlikely to subside anytime soon there. So why is Kerala different from most other states? It is because the state has been trying to control the reach of the pandemic, and succeeding to an extent.
Reach until March-end was ~26% in Kerala. In contrast, UP was 50+%. So were several other states. Strategy of aggressively controlling reach works well when one has resources and people cooperate. Otherwise one gets a large number of cases for extended period as is happening now.
Now that reach appears close to maximum, control on contact rate will determine how fast the pandemic spreads. At present, contact rate is controlled due to lockdown, leading to slow rise in cases. The moment lockdown is lifted, cases will rise sharply.
Is Kerala strategy better? This depends on which one prefers: extended lockdown leading to economic misery or sharp rise leading to stress in health infra for a short period. My view is that Kerala health infra is decent so it should go for a sharper rise leading to quicker end.
Kerala is testing well though -- it is missing only 4.5 cases for every detected case. Overall for India, about 32 cases are undetected for every detected one.
Much discussion around Kerala model these days. Two sides of the debate are using same data, low seropositivity and high TPR, to argue opposite points! The supporters of government say that low seropositivity demonstrate success of containment strategy.
And high TPR show that smart testing is being done. Opponents say that low seropositivity mean there is much larger susceptible population that other states which means pandemic has still a long way to run there, and high TPR indicates that infection is spreading significantly.
Both are true, but, only partially. Let me explain why. The plot below is the entire timeline for Kerala showing how the values of reach and contact rate parameters have changed to influence the trajectory. The values are reasonably precise thanks to calibration via serosurvey.

Until August-end, reach in Kerala was a mere 3%. This demonstrates success of containment strategy adopted by the state -- the pandemic could not even reach 97% of population! In September, reach jumped to 11% due to onset of festival season.
It jumped again to 21% in October-end, but the cases did not rise due to reduction in contact rate. Both the parameters increased slowly over next four months resulting in almost flat trajectory that eventually came down in February.
And then delta-variant struck resulting in sharp increases in both reach and contact rate. Reach is now nearly 94% thanks to another sharp rise during mid-June to mid-July.
The containment strategy adopted by the state was a success until February. It managed to keep most of the population away from the pandemic. However, with onset of delta-variant, the strategy has not worked well resulting in spread of pandemic everywhere.
With seropositivity around 52% at present and pandemic spread over nearly entire population, there is a long way to go before herd immunity is reached. There are now two options available: keep contact rate low through lockdowns, or allow it to increase further by opening up.
If contact rate is brought down from its current value of 0.33, the numbers will start reducing, however, herd immunity will not be reached and lockdown will have to be kept until a large fraction is vaccinated.
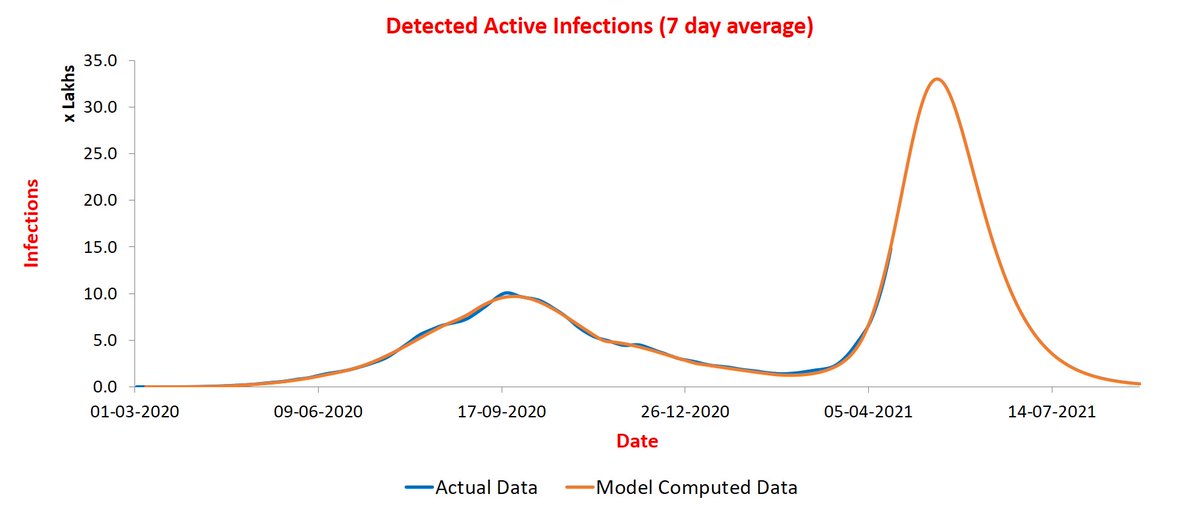
If strict lockdown is lifted and basic rules are enforced like wearing masks, avoiding crowding etc, the contact rate should settle down around 0.35. The resulting trajectory is shown below by dashed line. It shows a peak of around 25K infections by mid August.

By September, seropositivity would be 75% and then even without any precautions cases will not rise. To me, this appears a better strategy. Kerala already has had a very long lockdown leading to significant economic and emotional stress. It is time to open up.
• • •
Missing some Tweet in this thread? You can try to
force a refresh