With almost 1000 cases a day it's clear the Cautious Reopening is now off the rails & in next tweet I have a new plot. But added today as red dots
994 cases, 186% last Thursday
80 hospital, 138% "
22 ICU, 129% "
/1
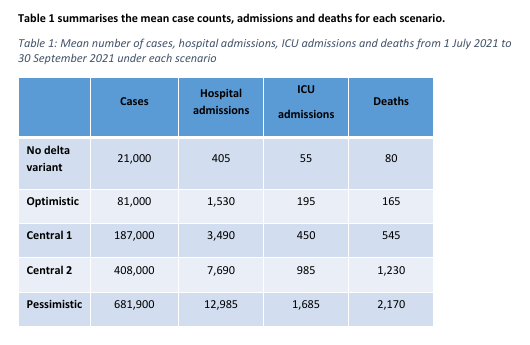
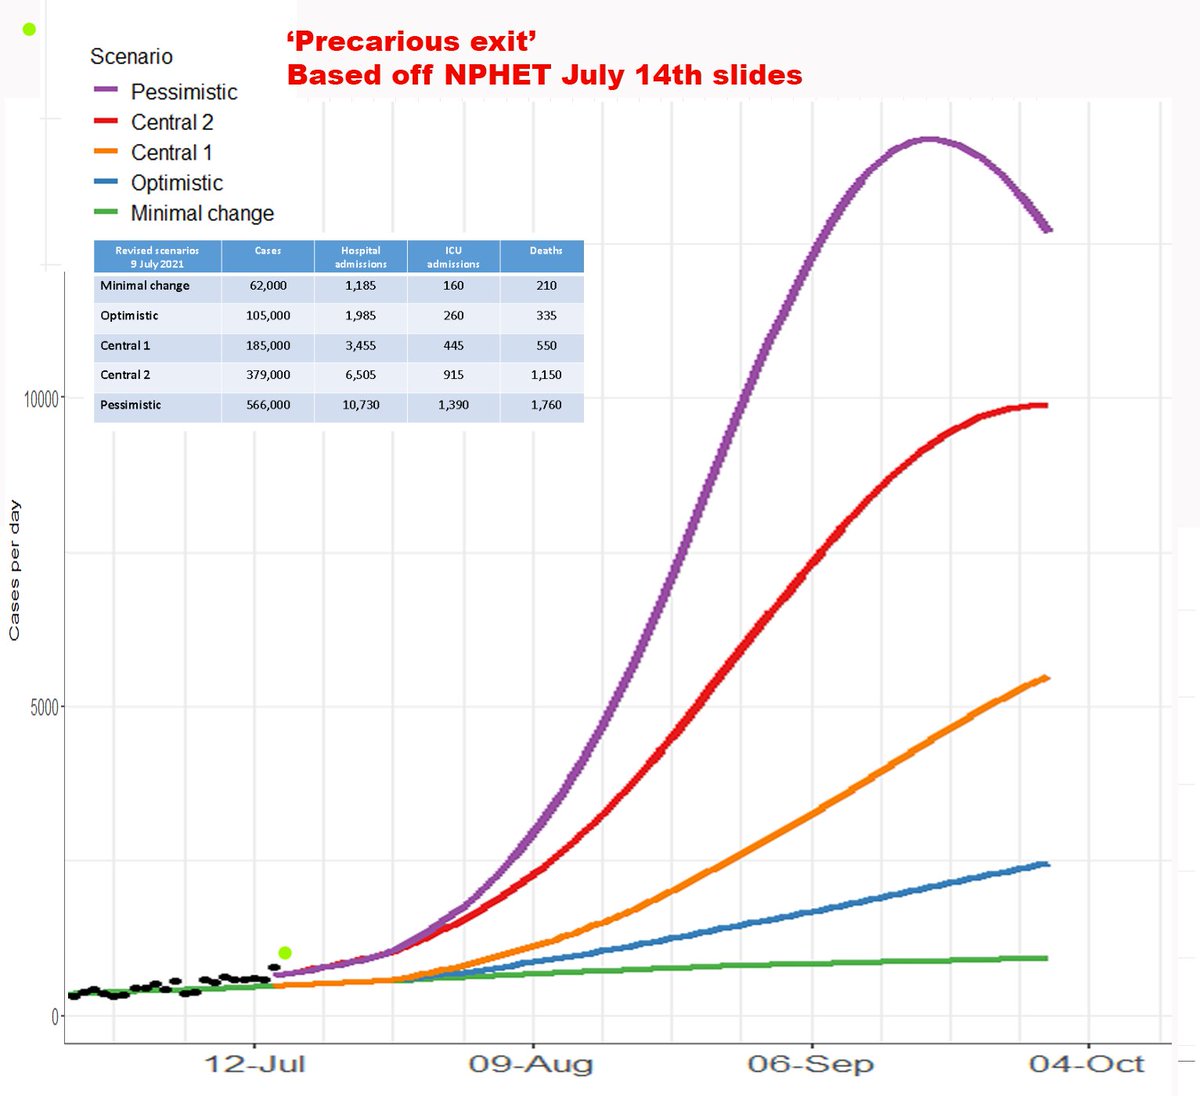
New plot using the NPHET scenarios to track what I'm calling the Precarious Exit. Cases added as bright green dot, you'll note we are already doing worse than the worst case NPHET presented yesterday. Next tweet I look at how much worse /2
We have had 4754 cases in week which is 140% last week- project forward at that rate to end September & we have 840k cases accumulate, 19k hospitalised at current rate of 2.3% cases
4294
6012
8416
11783
16496
23094
32332
45265
63370
88719
124206
173888
243444
/3
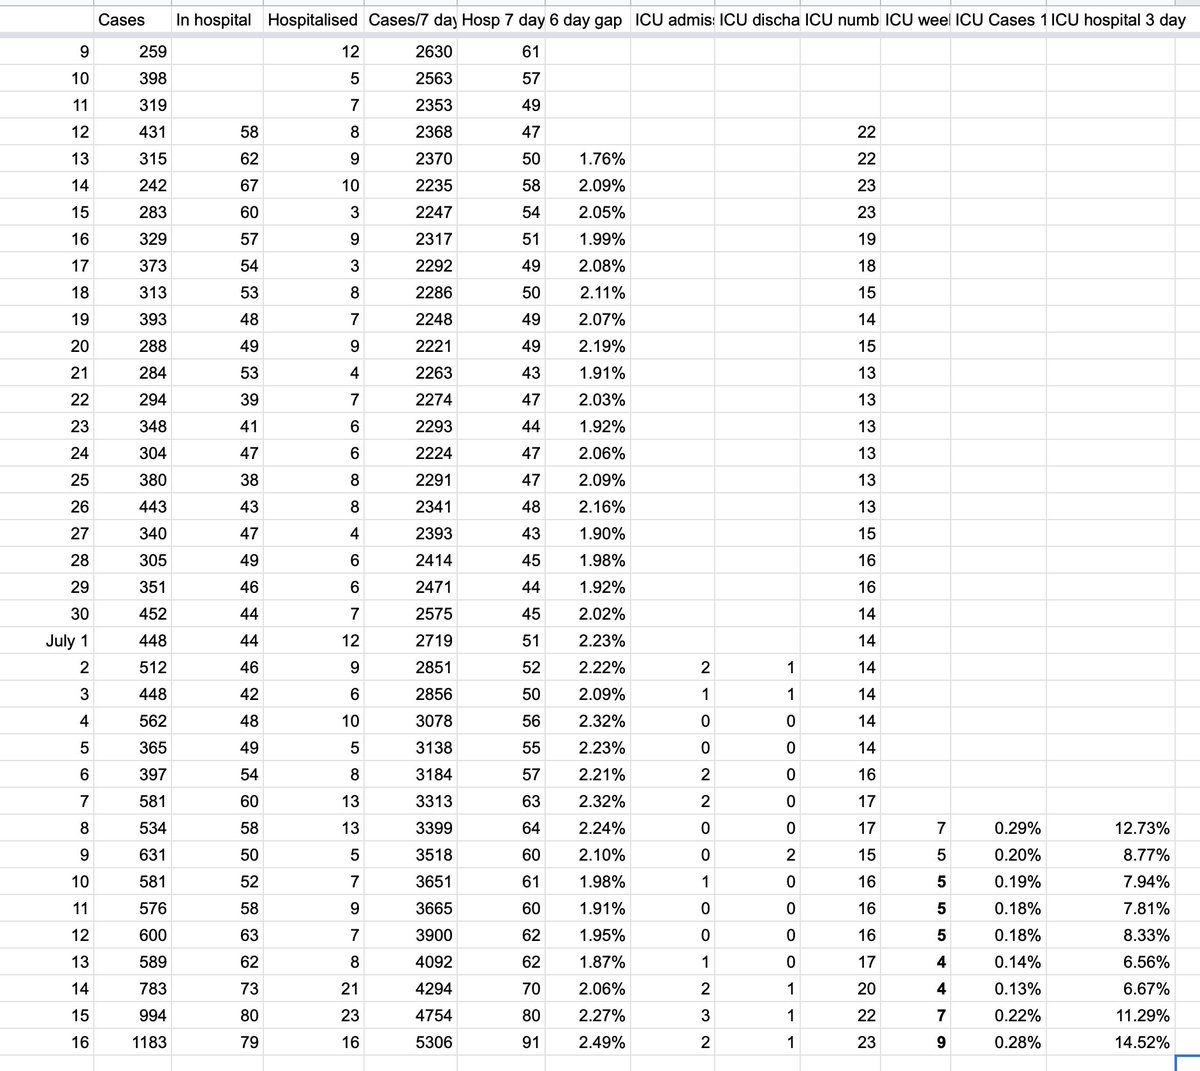
I'm tracking hospitalisations and ICU as a percentage of cases here - this is the record of this going back over 6 weeks. It varies a little between 1.8% and 2.3%. ICU is more variable but 6-10% of hospitalisations so that could be 1900 into ICU /4
All of these simple math operations on the current growth rate put us in a worse situation than the worst NPHET scenario BEFORE indoors even opens. Perhaps this is a pair of bad days but if no improvement opening indoors would simply lead us to lockdown in mid August /5
Figures from the north today are even worse & despite higher vaccination rate they are also seeing a 2.3% hospitalisation rate. It's becoming very clear that until all are vaccinated cases have to be kept low otherwise hospitals will be overwhelmed /6
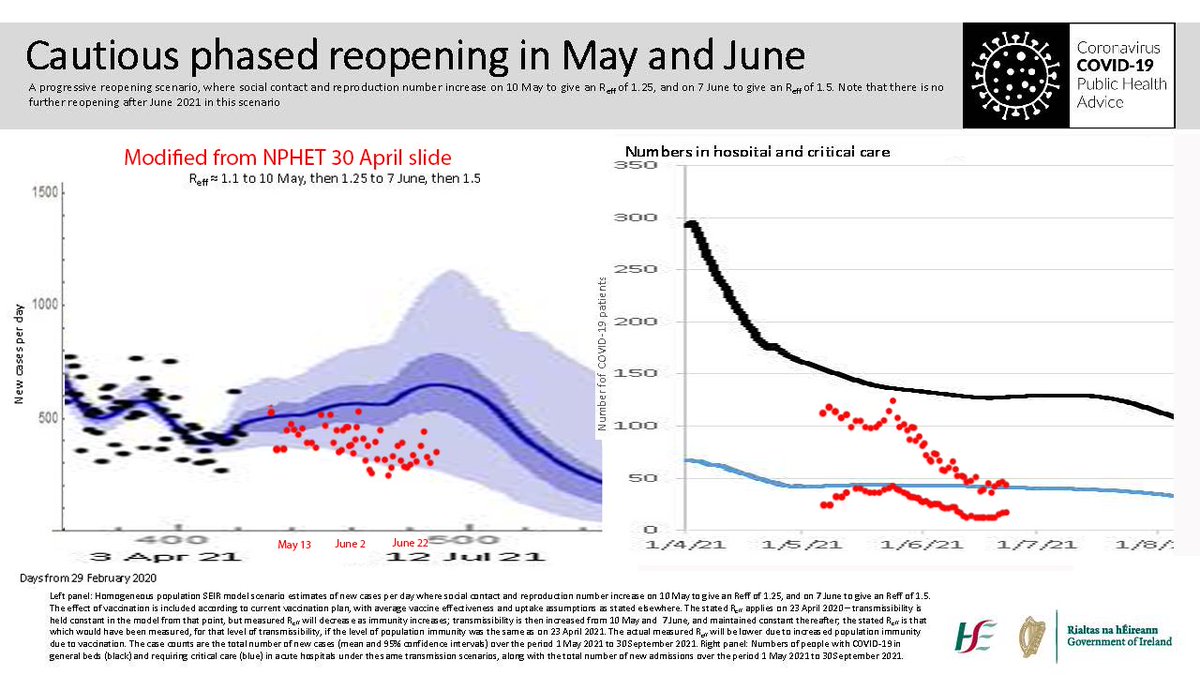
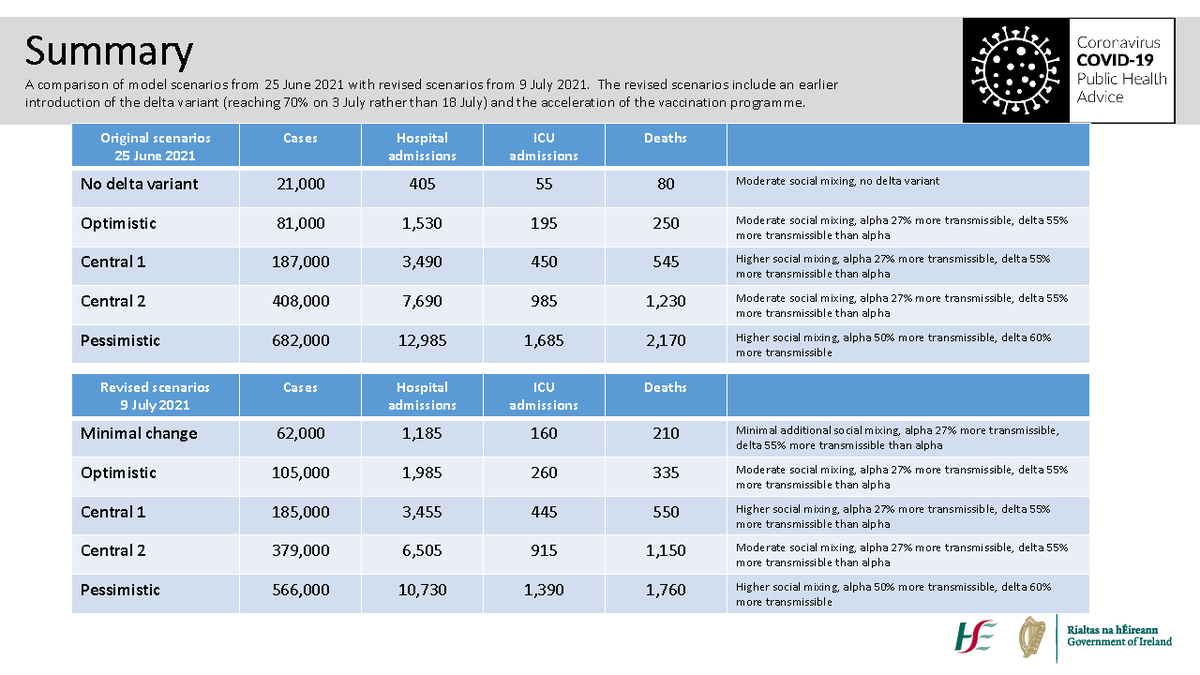
The template for the Precarious Exit uses these two NPHET slides from last night. As anyone following me for a while knows I've used similar plots to track progress in the last 5 months & then are useful at seeing the direction of travel beyond individual good or bad days /7
I favour using simple math calculations rather than 'models' as I think its much easier for most of us to understand simple math operations like percentages, multiplications & compound interest. Both produce similar results but the explanatory impact of the math is better /8
With Delta it's clear that everyone is getting immunity the easy way via vaccination or the hard way via surviving infection. Policy has to be directed at making sure of the 2 million left as many as possible get it the easy way, both for them but also to keep other healthcare

• • •

Missing some Tweet in this thread? You can try to force a refresh
 

Keep Current with Andrew Flood 👨🏻‍💻📝🕺

Andrew Flood 👨🏻‍💻📝🕺 Profile picture

Stay in touch and get notified when new unrolls are available from this author!

Read all threads

This Thread may be Removed Anytime!

PDF

Twitter may remove this content at anytime! Save it as PDF for later use!

Try unrolling a thread yourself!

how to unroll video
  1. Follow @ThreadReaderApp to mention us!

  2. From a Twitter thread mention us with a keyword "unroll"
@threadreaderapp unroll

Practice here first or read more on our help page!

More from @andrewflood

16 Jul
Sigh - this was not how I hoped the #Covid19Ireland Cautious Reopening plot would end but the last 3 case dots tell a story thats sadly unmistakable - adding as the final red dots
1183 cases is 187% of last Friday
79 hospital, 158% last Friday
23 ICU, 153% last Friday
/1 Image
What happens next will be tracked on the Precarious Exit plot which has not improved since yesterday, indeed the 5306 cases this week being 151% of the previous week is. a lot worse, I'll show how much in the next 2 tweets /2 Image
I've been tracking what percentage of cases end up in hospitals and what percentage of those go to ICU. As the force of infection increased these have got a lot worse, 2.5% cases hospitalised & almost 15% of those going to ICU when you account for lag effects. /3 Image
Read 11 tweets
15 Jul
HSE CEO Paul Reid says close to 1000 cases will be reported today, the north had reported 1083 cases (and hospital admissions up 154% on last week). That makes it quite likely we will have 2,000 new cases reported for the entire island within hours.
That 1000 is going to be putting us on the NPHET worst case scenario, indeed potentially much worse. If tomorrow & Saturday is similar there is no way the risk of reopening indoor hospitality should proceed Monday - it would guarantee a Lv4/5 lockdown by mid August
This week there have been 80 hospitalisations which is 2.3% of the 3518 cases in the week to the July 9th. The north is also seeing 2.4% hospitalisation. About 10% of hospitalisations end up in ICU. Continued cases rises at this rate will rapidly shut down other healthcare
Read 4 tweets
14 Jul
Cautious Reopening plot tells its own story of things going wrong as all the stats lurch in the wrong direction as Delta exceeds 80% of cases. As red dots
783 cases, 135% last Wednesday
73 hospital, 122% last Weds
20 ICU, 118% last Weds
/1
The 4294 cases this week are 130% previous week, at that rate there would be 400k cases by end of September with 8,000 admitted to hospital. That doesn't look very sustainable & would likely lead to a lockdown unless that rate reduces - we are close to central 2 scenario /2
That Central 2 Scenario is pretty grim, including 1150 additional deaths & its worrying thats the current trajectory before the high risk opening of indoor hospitality /3
Read 4 tweets
13 Jul
Cautious Reopening with added as red dots todays
589 cases, 148% last Tuesday
62 hospital, 115% last Tuesday
17 ICU, 106% last Tuesday
We crossed 4k cases in a week today, 4092 this week are 124% previous weeks, I'll come back that down thread /1 Image
What may be the key metric is the percentage of cases that become hospitalised - that has drifted downwards slightly to 1.9% however as cases are rising faster we will still see the numbers being hospitalised and then numbers in hospital climbing. /2 Image
At each week being 124% of previous & 1.9% hospitalised by Sept 30th we'd see 260k cases and 5,000 hospitalisations. In other words we appear to currently be heading for somewhere between the NPHET Central scenarios. But thats before the impact of opening indoor hospitality /3 Image
Read 5 tweets
1 Jul
Somewhat to my surprise this late in the pandemic I'm, still seeing 'cases may be rising but hospitalisations aren't' so I thought it would be useful to do a broad timeline of the delays between infection & the various stats warning us. They can run into weeks /1
1. Infections are invisible, we don't know they have happened, no test can pick them up until some days later. Delta has been observed to double in 4.5 days meaning by the time we have a clue 1000 infections are already 4000
2. Cases are when someone has felt ill or has been told they are a close contact, booked a test, attended the test, the swab has gone to a lab, the lab has got a result & that result is Quality assured. It varies with the speed of those steps but Cases are probably 9+ days
Read 12 tweets
29 Jun
In a day of unhappy news unfortunately the Cautious Reopening plot is also taking a turn for the worse - all 3 indicators have risen in comparison with last Tuesday. Added as red dots
351 cases, 119% last Tuesday
46 hospital, 118% last Tuesday
16 ICU, 123% last Tuesday /1 Image
Earlier today we heard Delta had reached being 55% of cases . This may be why what was working now isn't, the
2471 cases in last 7 days is 109% previous 7 but week before we had a 22% reduction. One positive - 44 hospital cases in the week is 1.9% of cases to J23, a .1% drop /2
I summarise the key points in the latest NPHET to CMO letter in this thread but the 1st line of that table compared to the rest gives an idea of just how much Delta has messed up what was previously a convincing reopening plan /3 Image
Read 4 tweets

Did Thread Reader help you today?

Support us! We are indie developers!


This site is made by just two indie developers on a laptop doing marketing, support and development! Read more about the story.

Become a Premium Member ($3/month or $30/year) and get exclusive features!

Become Premium

Too expensive? Make a small donation by buying us coffee ($5) or help with server cost ($10)

Donate via Paypal Become our Patreon

Thank you for your support!

Follow Us on Twitter!

:(