
Weekly Macro Review July 18, 2021
1/12
↘️↗️↘️↗️
During phase transitions, old trends break and new ones form
The market machine is “confused.” How could it not be with inflation ↗️ bond yields ↘️ and the USD and GOLD ↗️?
Job#1 during this chop is capital preservation
1/12
↘️↗️↘️↗️
During phase transitions, old trends break and new ones form
The market machine is “confused.” How could it not be with inflation ↗️ bond yields ↘️ and the USD and GOLD ↗️?
Job#1 during this chop is capital preservation
2/12
The USD 92.69 +0.62% is back to ♉️ trade (t) and trend (T)
Both the EUR 1.181 -0.59% and AUD -1.26% are 🐻 and hanging onto critical technical support.
Chart: $USD 92.69 +0.62% is +0.52% over (t) duration and +1.26% over (T) duration
The USD 92.69 +0.62% is back to ♉️ trade (t) and trend (T)
Both the EUR 1.181 -0.59% and AUD -1.26% are 🐻 and hanging onto critical technical support.
Chart: $USD 92.69 +0.62% is +0.52% over (t) duration and +1.26% over (T) duration

2A/12
Chart: $EURUSD 1.181 -0.59% is trading at critical support.
A weekly close < 1.170 could take this ↘️ to ~ 1.12 over the next 3-4 months.
Chart: $EURUSD 1.181 -0.59% is trading at critical support.
A weekly close < 1.170 could take this ↘️ to ~ 1.12 over the next 3-4 months.

2B/12
Chart: $AUDUSD 0.74 -1.26% is -4.32% over a (T) duration.
A break below .74 and the Aussie could go to .69.
Chart: $AUDUSD 0.74 -1.26% is -4.32% over a (T) duration.
A break below .74 and the Aussie could go to .69.

3/12
The short end of the curve ↗️ and the long end ↘️, compressing the 10/2s to 107.2 BPS - in the face of 5.4% CPI and 7.2% PPI, no less.
2Y .228 +6.05%
5Y .781 -0.76%
10Y 1.30 -4.48%
30Y 1.928 -3.12%
MOVE 58.24 -2.8%
Chart: $TNX ↘️ after failing to hold a ♉️ 🏁
The short end of the curve ↗️ and the long end ↘️, compressing the 10/2s to 107.2 BPS - in the face of 5.4% CPI and 7.2% PPI, no less.
2Y .228 +6.05%
5Y .781 -0.76%
10Y 1.30 -4.48%
30Y 1.928 -3.12%
MOVE 58.24 -2.8%
Chart: $TNX ↘️ after failing to hold a ♉️ 🏁

4/12
Treasury and corporate ETFs ↗️ with high yield, convertibles, and IVOL ↘️
$TLT +1.15%
$TIP 129 +0.84%
$BNDX +0.52%
$IEF +0.47%
$BND +0.14%
$LQD +0.11%
$CWB -2.54%
$HYG -0.38%
$IVOL -0.25%
Chart: BNDX ♉️ +0.52% is +0.95% over (t) duration and + 0.82% over (T) duration
Treasury and corporate ETFs ↗️ with high yield, convertibles, and IVOL ↘️
$TLT +1.15%
$TIP 129 +0.84%
$BNDX +0.52%
$IEF +0.47%
$BND +0.14%
$LQD +0.11%
$CWB -2.54%
$HYG -0.38%
$IVOL -0.25%
Chart: BNDX ♉️ +0.52% is +0.95% over (t) duration and + 0.82% over (T) duration

5/12
The ↘️ in real yields (-4.1%) is supportive for GOLD +0.24%, which ↗️ to 1835 before falling back to close 1815.
Metals ↔️ on the week
$GOLD +0.24% ♉️
$SILVER -1.64% 🐻
$PLAT +1.17% 🐻
$COPPER -0.62% ♉️
Chart: $COPPER ♉️ is +3.92% over (t) and +3.67% over (T) durations
The ↘️ in real yields (-4.1%) is supportive for GOLD +0.24%, which ↗️ to 1835 before falling back to close 1815.
Metals ↔️ on the week
$GOLD +0.24% ♉️
$SILVER -1.64% 🐻
$PLAT +1.17% 🐻
$COPPER -0.62% ♉️
Chart: $COPPER ♉️ is +3.92% over (t) and +3.67% over (T) durations

5A/12
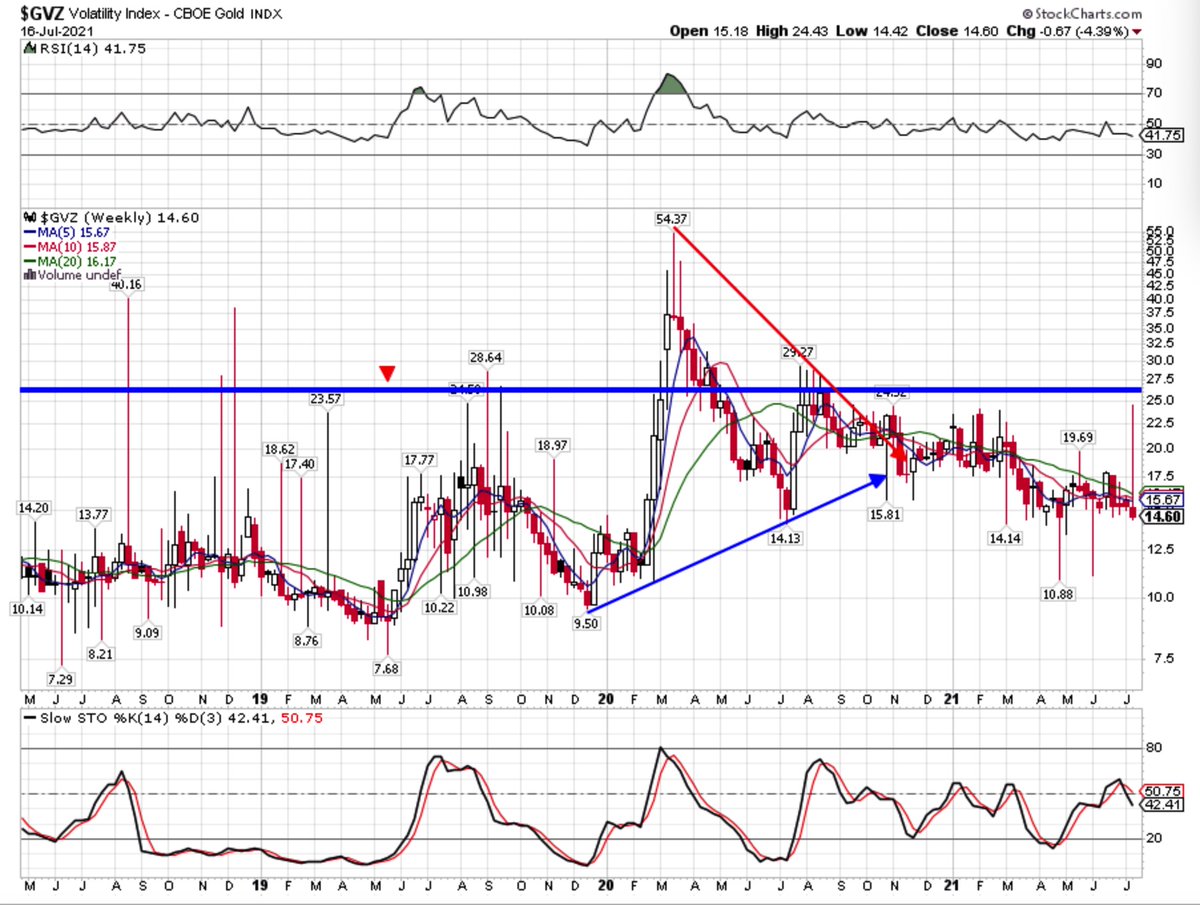
Gold volatility is in a supportive regime for $GOLD prices.
Chart: $GVZ 14.60 -4.39% is -18.44% over the past month
Gold volatility is in a supportive regime for $GOLD prices.
Chart: $GVZ 14.60 -4.39% is -18.44% over the past month
6/12
Hydrocarbons (ex-Natty) finished ↘️ on the week after trading near cycle highs.
All remain ♉️ (t) + (T)
$OVX 37.15
$WITC 71.56 -4.02%
$BRENT 73.30 -3.02%
$GASO 2.235 -2.4%
$NATGAS 3.664 +0.11%
Chart: GASO +58.51% YTD is +3.0% over (t) and +9.4% over (T) durations
Hydrocarbons (ex-Natty) finished ↘️ on the week after trading near cycle highs.
All remain ♉️ (t) + (T)
$OVX 37.15
$WITC 71.56 -4.02%
$BRENT 73.30 -3.02%
$GASO 2.235 -2.4%
$NATGAS 3.664 +0.11%
Chart: GASO +58.51% YTD is +3.0% over (t) and +9.4% over (T) durations

7/12
Grains bounced ↗️ with a vengeance
$CORN 552 +6.77%
$WHEAT 692 +12.6%
$SOYB 1392 +4.7%
$SUGAR 17.71 +1.49%
Chart: $WHEAT +12.6% and back to ♉️ trade (t) +4.02% and trend (T) +5.73%
Grains bounced ↗️ with a vengeance
$CORN 552 +6.77%
$WHEAT 692 +12.6%
$SOYB 1392 +4.7%
$SUGAR 17.71 +1.49%
Chart: $WHEAT +12.6% and back to ♉️ trade (t) +4.02% and trend (T) +5.73%

7A/12
Timber!!!
$LUMBER -28.94% on volume
Timber!!!
$LUMBER -28.94% on volume

8/12
#Dispersion between large cap and small cap US stocks though all were ↘️ on the week; volatility
$SPX 4327 -0.97%
$COMPQ 14427 -1.87%
$IWM 214.95 -5.05%
$VIX 18.45 +14.03%
$VXN 21.06 -0.8%
$RVX 26.44 +11.7% 🔻
Chart: $IWM 🐻 is -3.23% (t) and -4.32% (T) durations
#Dispersion between large cap and small cap US stocks though all were ↘️ on the week; volatility
$SPX 4327 -0.97%
$COMPQ 14427 -1.87%
$IWM 214.95 -5.05%
$VIX 18.45 +14.03%
$VXN 21.06 -0.8%
$RVX 26.44 +11.7% 🔻
Chart: $IWM 🐻 is -3.23% (t) and -4.32% (T) durations

9/12
Top performing US Sectors
$XLU +2.59%
$XLP +1.27%
$XLRE +0.7%
Worst performing sectors
$XLE -7.89%
$XLY -2.45%
$XLB -2.28%
$XLF -1.61%
Chart: XLRE is +11.67% over (T) duration, double the next closest sector XLV +5.88%
Top performing US Sectors
$XLU +2.59%
$XLP +1.27%
$XLRE +0.7%
Worst performing sectors
$XLE -7.89%
$XLY -2.45%
$XLB -2.28%
$XLF -1.61%
Chart: XLRE is +11.67% over (T) duration, double the next closest sector XLV +5.88%

10/12
Europe ↘️ under selling pressure, while Asian stocks ↗️
$CAC 6460 -1.06%
$DAX 15540 -0.94%
$HSI +2.41% 🐻
$KOSPI 3277 +1.83% -back to ♉️
$SSEC +0.43% -back to ♉️
$NIKK +0.22% 🐻
Chart: $DAX neutral at +0.6% (t) and +0.52% (T) duration. Needs to rally next week
Europe ↘️ under selling pressure, while Asian stocks ↗️
$CAC 6460 -1.06%
$DAX 15540 -0.94%
$HSI +2.41% 🐻
$KOSPI 3277 +1.83% -back to ♉️
$SSEC +0.43% -back to ♉️
$NIKK +0.22% 🐻
Chart: $DAX neutral at +0.6% (t) and +0.52% (T) duration. Needs to rally next week

11/12
With USD ↗️, European ETFs fared worse than their indices
$EWP -4.18% 🐻
$EWU -2.59% 🐻
$NORW -2.37% 🐻
$EWI -2.17% 🐻
Emerging market ETFs outperformed
$EWZ +1.75% ♉️
$EWH +1.32% 🐻
$EWW +1.25% ♉️
$FXI +0.57% 🐻
With USD ↗️, European ETFs fared worse than their indices
$EWP -4.18% 🐻
$EWU -2.59% 🐻
$NORW -2.37% 🐻
$EWI -2.17% 🐻
Emerging market ETFs outperformed
$EWZ +1.75% ♉️
$EWH +1.32% 🐻
$EWW +1.25% ♉️
$FXI +0.57% 🐻
12/12
To preserve capital, I cut losers all of which had a great run
EWP
EWN
EWU
IWN
I’m also adding to ♉️ trends on pullbacks
GLD
TLT
LQD
TIP
HYG
XLE
AMLP
DBC
DBB
DBA
Hedging with $TAIL and short EWJ and EWH
Have super profitable 💰week!
To preserve capital, I cut losers all of which had a great run
EWP
EWN
EWU
IWN
I’m also adding to ♉️ trends on pullbacks
GLD
TLT
LQD
TIP
HYG
XLE
AMLP
DBC
DBB
DBA
Hedging with $TAIL and short EWJ and EWH
Have super profitable 💰week!
• • •
Missing some Tweet in this thread? You can try to
force a refresh


