2/ You might notice that the right graph has a bit of a different shape than the left graph. DFL runner-up @_RyanWinkler got only slightly fewer votes than @epmurphymn, and was just slightly ahead of @CedrickFrazier in turn, and so on.
3/ So as is my wont, I dove into the data. And it turns out that there’s something very interesting going on: Unlike just about everyone else, @ZachDuckworth (or someone close to him) actually *made an effort to win this contest* by mobilizing supporters to vote strategically.
@ZachDuckworth 4/ This contest used approval voting, where voters could pick as many nominated lawmakers as they wanted. Most votes won.
So I took all the ballot sizes — voter A voted for 3 lawmakers, voter B for 8, etc. — & calculated for each lawmaker the average size of balots listing them
@ZachDuckworth 5/ And it turns out that of the 42 people who voted for @ZachDuckworth as best #mnleg orator, *38* of them ONLY voted for Duckworth.
In contrast, @epmurphymn got 39 votes, and only *3* of them just listed Murphy.
Duckworth’s average ballot size was off-the-charts low.
@ZachDuckworth@epmurphymn 6/ My conclusion that this was deliberate and not happenstance is reinforced by looking at the timing for each candidate’s votes. @ZachDuckworth’s votes came in a huge, concentrated block near the end of the contest.
@ZachDuckworth@epmurphymn 7/ Now, I want to be clear: None of this violated any rules! I didn’t ban or discourage strategic voting. It’s just striking that one, & only one lawmaker intentionally played to win here (and it worked).
I enjoyed all three MCU TV series so far, but “Loki” was by far my favorite — and the only one of the three to stick the landing in the final episode.
This was despite, or perhaps because of, the fact that it was basically just a good Master story from Doctor Who.
Of the three shows, it had the tightest integration between plot and theme. Showdowns weren’t resolved my mere punching matches (or magical punching matches) but by key charater choices that felt organic and earned, but not automatic.
19th Century Congressmen who were accused of scandal but felt they had done nothing wrong would not uncommonly resign, go back to their districts, run in the special election to replace themselves, win, and come back to Congress with a new popular mandate.
For example, in 1856, Rep. Preston Brooks infamously beat Sen. Charles Sumner on the Senate with a cane while Rep. Laurence Keitt held back onlookers. In the ensuing uproar, both men resigned, went back home, and were promptly reelected.
"A motion for Brooks' expulsion from the House failed, but he resigned on July 15 in order to permit his constituents to ratify or condemn his conduct via a special election... They approved; Brooks was quickly returned to office after the August 1 vote…"
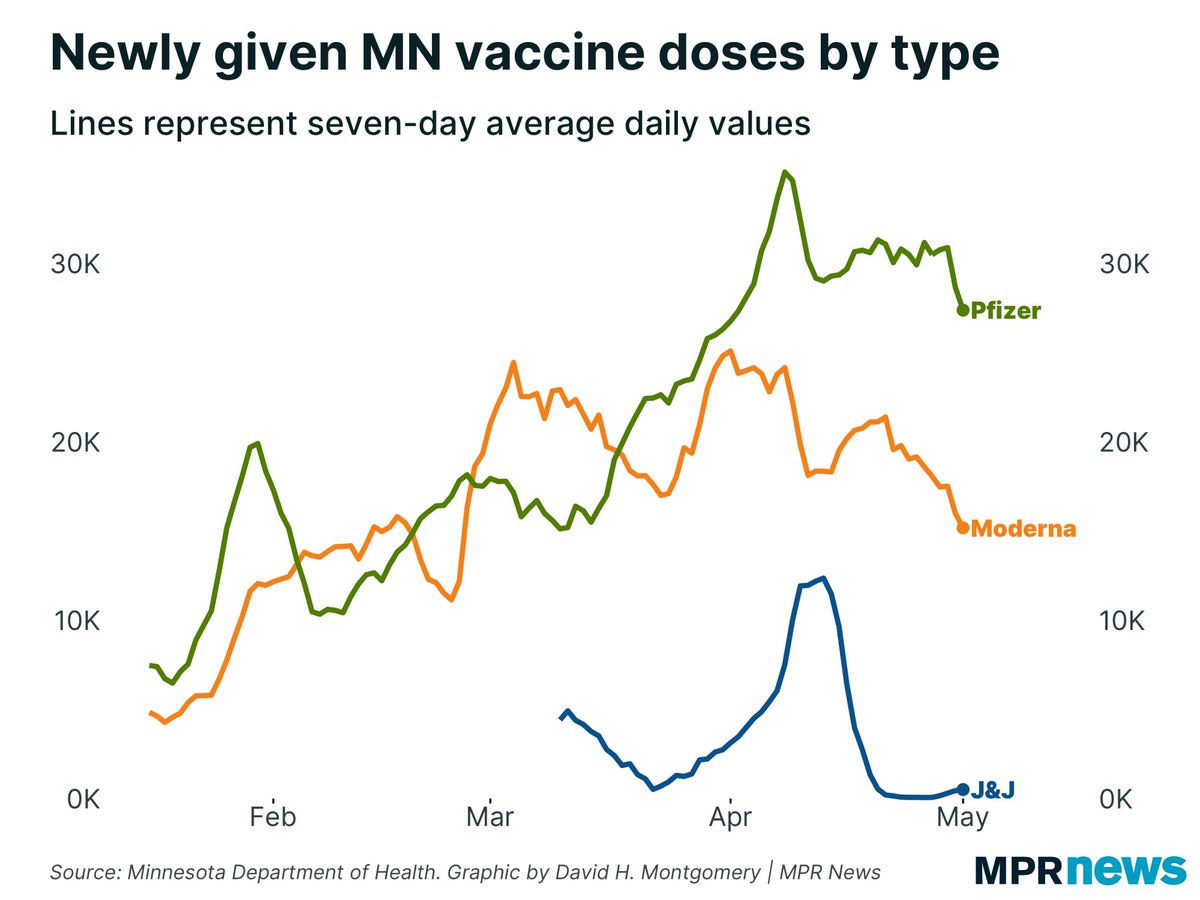
Today’s #COVID19 news in Minnesota is not great. The number of newly administered first doses is plummeting. I actually think the current levels are artificially low — we’ve been getting an average of 20K 1st doses per day — and due for a bounceback, but this isn’t good.
At the current pace, it’d take until late June to give 80% of Minnesotans their first vaccine.
A few weeks ago, we were chugging along at a mid-May pace.
J&J doses are starting to be given again, but only in relatively small numbers. Now Pfizer and Moderna doses are starting to decline, too.
1/ I’ll reiterate what I said about this dataset a few weeks ago. You should take this data with a huge grain of salt (though not necessarily dismiss it ENTIRELY), because of one warning sign you can see below: radical discontinuities along state lines.
2/ Here’s how this data was constructed: they surveyed a whole lot of people about vaccine hesitancy, and then they used demographic characteristics of those people to extrapolate to the entire population. Relatively standard technique, but with some obvious pitfalls.
3/ Here are the variables HHS used in their model: "age, gender, race/ethnicity, education, marital status, health insurance status,
household income, state of residence, and interaction terms between race/ethnicity and having a college degree."
In the 1990 Census, 12.1% of Americans were Black. In 2000, it was 12.3%. In 2010, it was 12.6%.
We don’t have figures for the 2020 Census yet. The 2019 ACS one-year estimate was 12.8% Black.
To be clear, I’m genuinely curious as to the intent here. Is this a more poetic way of repeating the more common charge about Black deaths at the hand of the government? Is there a conspiracy theory about 13% as a threshold? It’s very specific and very demographic.
Via @BitsyPerlman, here’s a fascinating redistricting idea I hadn’t encountered before, called “Primary Allocation.” Seats are allocated to parties proportionally via a statewide election. Then each party divides the state into districts for their reps… fordham.edu/download/downl…
@BitsyPerlman First, that’s fascinating to reverse the order of the primary and general elections — the “general” comes first to allocate seats, then the “primary” comes second to choose who fills them! Not sure if that’s better or not, but it’s counterintuitive and I like that.
@BitsyPerlman Second, it gets at two competing impulses in electoral system design: that results ought to be roughly proportional to the population, and that everyone should have “their” representatives.