Remember how, back in April/May, the decision was made that under-30s and then under-40s should be given the option to have a vaccine other than AstraZeneca, because of the risks of side-effects? Well, the calculus has now changed and the benefits now probably outweigh the risks
It comes back to this chart. You might remember this from when Jonathan Van-Tam announced the decision. The point was that the bars on the right (the risks of blood clot events) were bigger than the bars on the left (the risks of getting #COVID19 and going into ICU) for under-40s
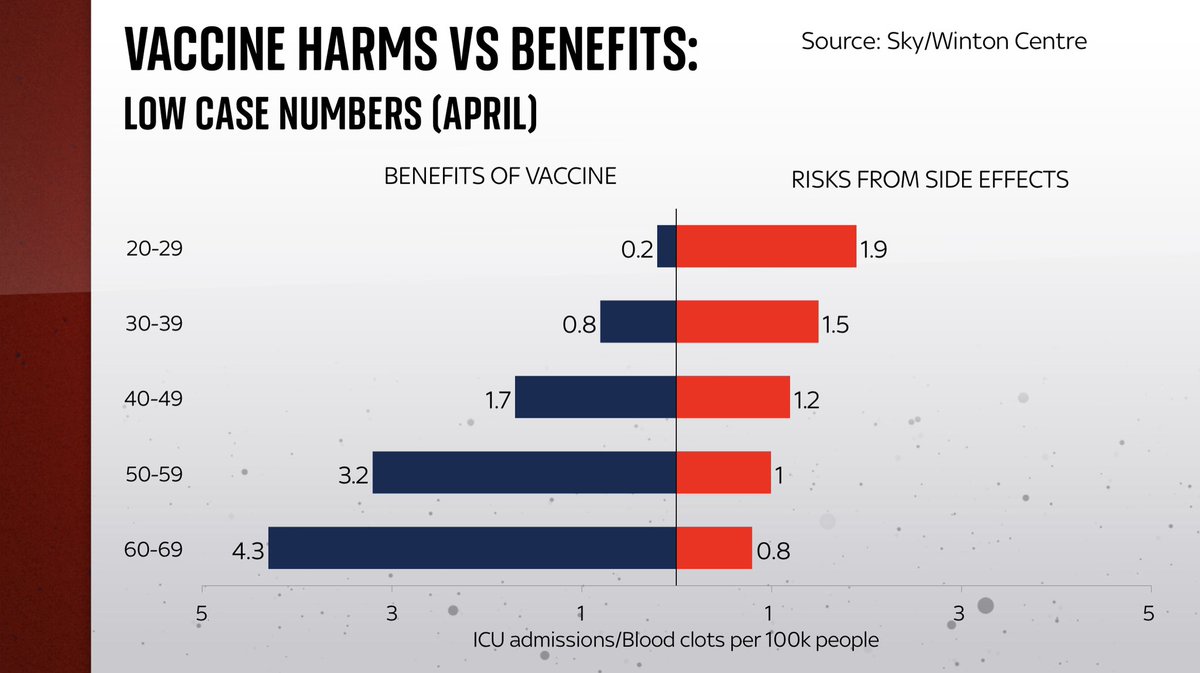
That chart was predicated on the notion that the risk of getting #COVID19 was pretty low. It was, back in April, because only one in 600 people had the virus. But since then things have changed. Now it’s one in 75 who have #COVID19. Meaning those bars on the right are bigger.
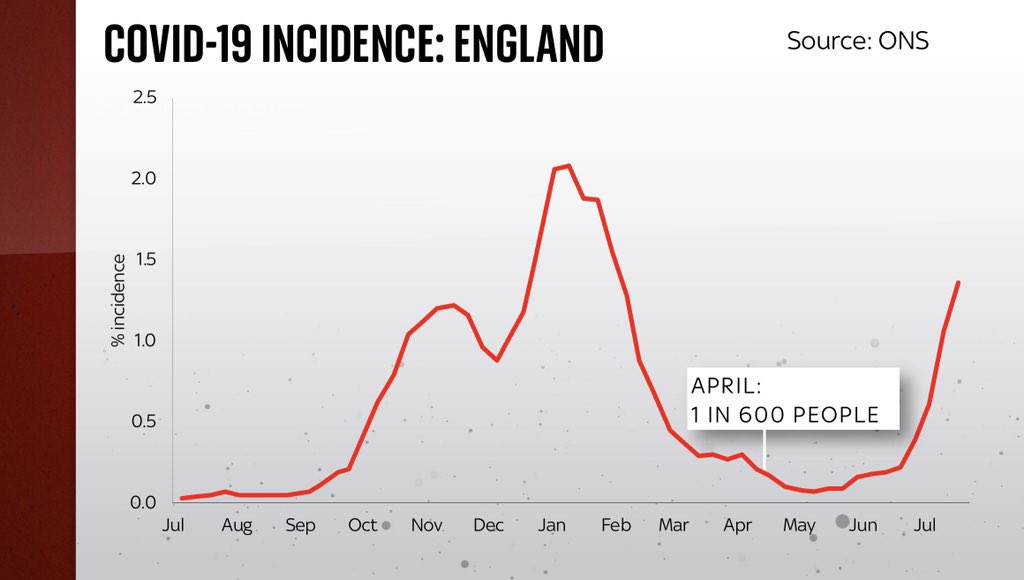
The risk for unvaccinated people of getting #COVID19 & going into ICU now outweighs the risk of a blood clot event for all age groups, at least according to the calculus used in April/May. Here’s what the bar chart looks like with levels of #COVID closer to where they are now.
No vaccine is 100% safe. There are always risks - it’s delusional to pretend otherwise. But on the basis of the known and quantifiable risks, the benefits of the vaccine look like they outweigh the risks, even for those in their 20s and 30s, even for the AZ vaccine.
Imp to be clear abt what these charts do & don’t tell u. They’re comparing COVID ICU admission with one vaccine side effect - the clotting. Then again clots do seem to be the main major adverse reported effect thus far from AZ. ICU admission is far from the only COVID consequence
Moreover, the data here 👆on vaccine side-effects is based on numbers given by the MHRA to the Winton Centre which, AFAICT, haven’t been published in full elsewhere. There’s no confidence intervals. We could def do with more data & more transparency on these figures.
Still: the important point is that the calculus is shifting. It’s right and rational to consider benefits vs harms when deciding on the vaccine. But those risk/harm balances are constantly shifting. Right now with cases rising, they look different to how they did a few months ago

• • •

Missing some Tweet in this thread? You can try to force a refresh
 

Keep Current with Ed Conway

Ed Conway Profile picture

Stay in touch and get notified when new unrolls are available from this author!

Read all threads

This Thread may be Removed Anytime!

PDF

Twitter may remove this content at anytime! Save it as PDF for later use!

Try unrolling a thread yourself!

how to unroll video
  1. Follow @ThreadReaderApp to mention us!

  2. From a Twitter thread mention us with a keyword "unroll"
@threadreaderapp unroll

Practice here first or read more on our help page!

More from @EdConwaySky

12 Jul
Quick Covid data update. Cases heading higher, so too admissions. But the link between them is weaker than in previous waves.
In short, the coming months will be nerve-wracking.
Cases will get v v high. This will feel like a wave in that respect. But in other respects v different
Same data but on a log axis - now you can see that hospital admissions are now growing at almost the same rate as cases.
Roughly doubling every 11 days.
V unsettling. Especially given cases have further to rise. So what next?
Here’s a simple extrapolation of cases and hospitalisations (second chart is same data with log axes).
Extrapolate current growth rates and you’re talking abt 100k cases by late July.
Hospital admissions up to 1000 by 19 July, possibly touching 2000 by end July.
Read 10 tweets
7 Jul
Been a week and a bit since I did a COVID data update. Tbh the pattern is broadly the same as it was then: cases & hospitalisations growing. Both a bit faster than two weeks ago. But the link between them remains much weaker than in previous waves
Last time around we looked at the growth rate in cases and saw that if that continued it would mean 40k plus daily cases by “Freedom Day” July 19.
As you can see, that line is steeper. Points towards a higher level.
Current extrapolation suggests maybe 80/90k…
But hospitalisations are still broadly in line with that extrapolated line from a couple of weeks back. Ie heading up but less rapidly than cases. Where are they by 19 July? On basis of past fortnight’s daily growth rate, still 500-600. On basis of past week, 600-700.
Read 9 tweets
25 Jun
Few thoughts on UK COVID data.
There’s good news and bad news.
But the good news is that the good news outweighs the bad IMHO.
Let’s start with cases. They’re growing in the UK at a decent snap, albeit not as fast as winter. You can see this better in the log chart (2)
But the real question is not just about cases but whether they’re turning into deaths.
That was the case for most of the pandemic: look at how correlated these lines are.
But now look bottom right. Do they seem to be diverging? Looks like it (albeit still quite early days)
That brings me to the most encouraging bit of data out recently: the case fatality rate of the Delta/Indian variant vs Alpha/Kent and others.
Look! While 2% of those catching Alpha died, the CFR for Delta is only 0.3%. Massive improvement.
Read 17 tweets
15 Jun
What kind of impact will the Australia-UK trade deal have? Short answer is we don’t know, in part because we still have scant detail abt it, in part cos it generally takes a LONG time for these deals to be felt in our lives.
Even so, I think this is a big deal, for a few reasons:
The first thing to remember is the historical context. There are two lazy assumptions knocking around: 1. That the UK could never trade much with Aus given how far away it is and 2. Our trade with them really collapsed when we joined the EU and started imposing their tariffs…
Actually look at Australian trade as % of UK total, it’s clear it used to be REALLY high. Yes, this was partly because of war and partly because it was part of the sterling zone, thus locked into UK economy. But even in ‘50s/60s Aus accounted for 1 in 8 of all imports/exports
Read 18 tweets
14 Jun
There we have it. According to @borisjohnson the UK hasn’t passed the four tests laid out in Feb when the reopening timetable was announced.
A pretty clear pass on tests one and two (vaccines) and a pretty clear fail on test four (variants). Test three unclear.
Reopening delayed.
Here’s the q: what changed between the PM saying 12 days ago that he could see “nothing in the data” to change re-opening timetable and today?
Variant growth rate v similar.
Case growth rate v similar.
Not sure there’s any data we have now that we didn’t on June 2.
What changed?
The point of basing policy on DATA is that you actually follow the data.
Better still, you make it clear what levels of data will trigger what kind of action.
Why? That kind of transparency means people can use that data to plan their lives rather than hoping for leaks from No10
Read 6 tweets
6 Jun
"I don't recognise those figures".
This is odd given the figs @TrevorPTweets quoted to @MattHancock are govt's own figs from its NHS Test & Trace spreadsheets. They show it waited far longer to put India on the red list than Pakistan after its Covid positivity hit a certain level
Let me take you (& @matthancock) through it.
This may seem like water under the bridge but it MATTERS because:
1 we now have more of this Delta/Indian variant than almost any other country outside Asia
2 we still have little clarity on how govt decides on red/amber/green lists
It's worth saying at the outset that @MattHancock is absolutely right about one thing: when taking these decisions it's far better to focus on data collected through our testing system on incoming travellers than data you get from, for instance @OurWorldInData. So let's do that.
Read 12 tweets

Did Thread Reader help you today?

Support us! We are indie developers!


This site is made by just two indie developers on a laptop doing marketing, support and development! Read more about the story.

Become a Premium Member ($3/month or $30/year) and get exclusive features!

Become Premium

Too expensive? Make a small donation by buying us coffee ($5) or help with server cost ($10)

Donate via Paypal Become our Patreon

Thank you for your support!

Follow Us on Twitter!

:(