Are these the distressed sellers everyone's been anticipating for over a year?
Here's this week's #altosresearch look at the US real estate market. Thread and video:
🧵👇
1/7
Inventory rose to 402,000 unsold single family homes. That's a 3.2% climb on top of last week's 4%.
Just last week I said we'd peak below 400k in August. Oops.
But - is it a surge of sellers or cooling buyers?
2/7
Our Immediate Sales tracker has the insight. Of the 104,000 new listings this week. 21,000 of them sold immediately. That's the fewest in months, meaning more stayed unsold. Still crazy high, just slightly less crazy.
But, it's not a surge of distressed sellers. 3/7
As a result prices staying stronger, longer in the year. Expect prices to start a pullback in August. Just tiny downticks as of yet this season.
Median home price is $398,900 this week. Down only $100 from last week.
4/7
If demand continues to weaken, or accelerates, we'll see it here in this leading indicator: properties with price cuts.
While only 22.6% have taken a cut, that jumped 1% from last week. Watch this number to see if it jumps even more quickly. (See the video for details)
5/7
To understand demand in context, use our Market Action Index - at-a-glance "How's the market?"
At 57 this week, the MAI is still in record seller's market territory. This shows us that demand while cooling is still very very strong. No worries here at all.
6/7
If you're interested in the crazy US real estate market, maybe take 9 minutes with this week's @AltosResearch video. See it here first!
Inventory is climbing quickly - here's what's up:
7/7
• • •
Missing some Tweet in this thread? You can try to
force a refresh
Also: webinar this week! Link to register follows.
🧵 1/6
First prices:
Median home price hit $374,000 this week. Prices are, of course, surging each week and will continue through June at least.
Price of the newly listed cohort is showing reassuring signs of normal seasonality. Insane market not getting insanerer.
2/6
Total unsold inventory down to 310,000 single family homes this week. Ticking down a tad each week, not falling dramatically. A few more weeks before we hopefully see increase in this supply metric (🤞)
Time for the Monday @AltosResearch real estate market data thread!
This week - unseasonal seasonality!
1/7
Available inventory drops again this week. We're at 325,000 single family homes on the market. No trough in site yet. We've just had no signs of normal seasonal patterns this year.
2/7
The leading indicator prices of the newly listed cohort shot way up again this week. The gray-green line is where you see the market pricing adjusting in real-time to off-the-charts demand. These new listings will be transactions that close at higher prices in the future. 3/7
It's Monday so here's this week's AltosResearch.com Real Estate Inventory Crisis update!
1/5
Inventory drops another couple percent this week. Only 344,000 houses on the market *in the whole country*.
No bottom in sight yet. Thousands of homes going directly into contract bypassing the active inventory numbers altogether.
2/5
Prices are up 10% year over year. This massive price appreciation seems likely to continue for the whole year. Median home price in the US is $345,499 this week.
YoY price changes will jump in a month when the first 2020 lockdown comparisons kick in.
It's Monday, so it's time for the weekly US real estate data from @AltosResearch
We'll start with the latest view of the Inventory Crisis we're in.
thread 1/6
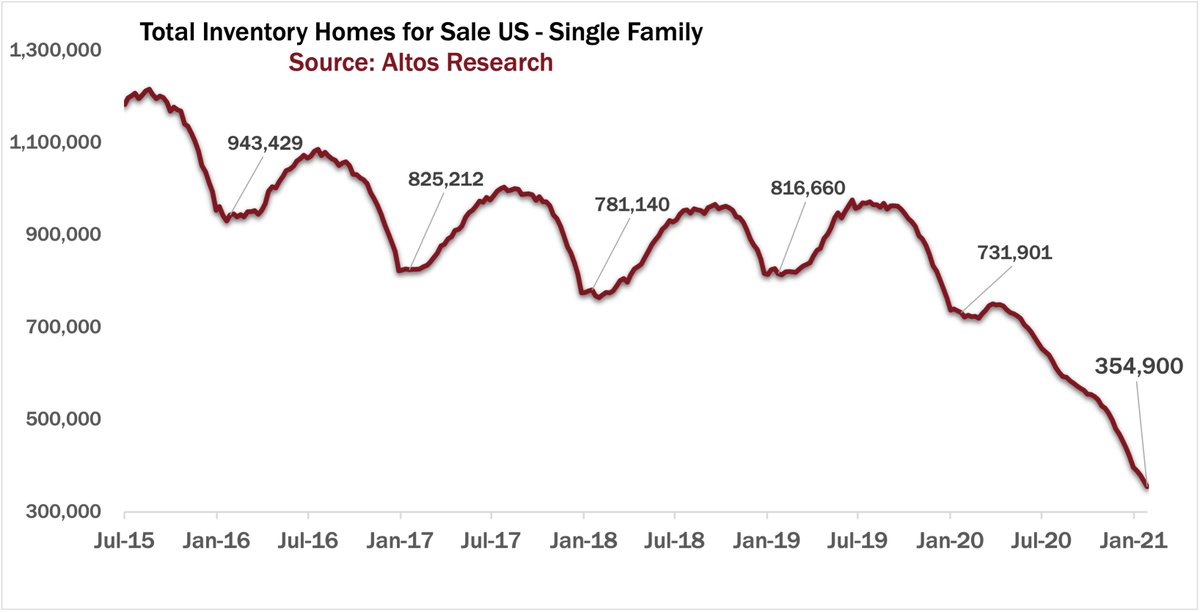
Total active inventory plummets yet again. Down to 355,000 single family homes on the market. Properties are moving so fast there are another roughly 10,000 that bypassed the active market altogether, going straight into contract, spending essentially zero days on market. 2/6
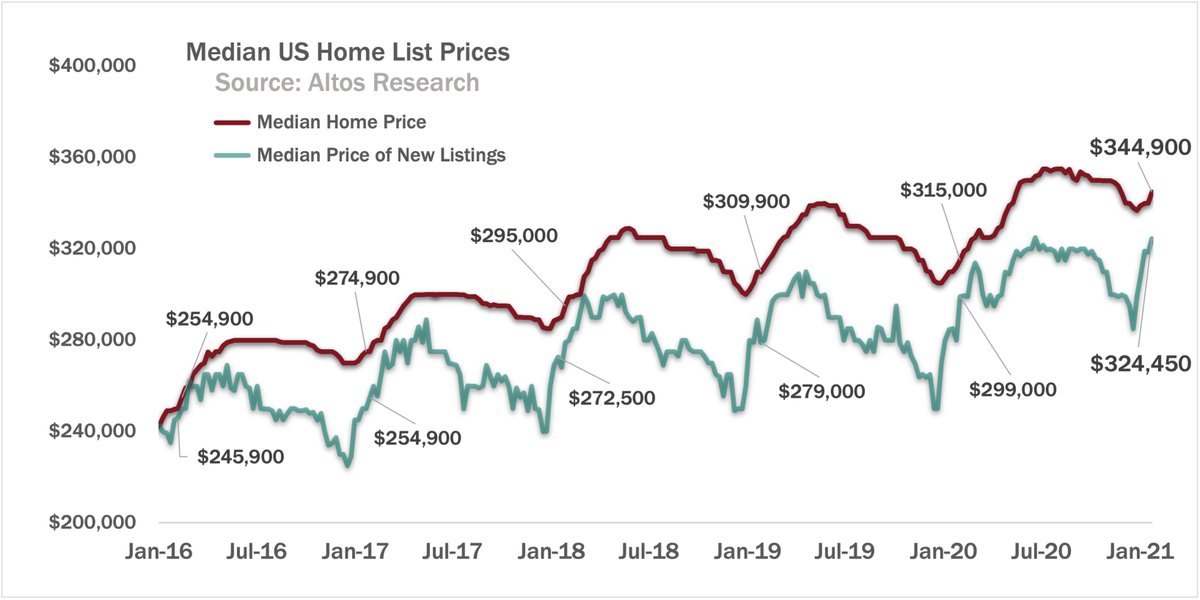
Unsurprisingly, prices are climbing. Up to $344,900, we're well on our way to another 10% price appreciation year. Massive equity gains for all homeowners.
It's Monday, so that means the latest real estate data from @AltosResearch and man the leading indicators are all aligning for another big year of home price appreciation.
1/5
On the inventory watch, we're down to just 389,000 single family homes on the market. Many new listings are getting offers so quickly they're bypassing our active market data and just going straight to pending-contract. 2/5
What's inventory going to look like throughout the year? Fingers crossed that we get a more seasonal pattern in listings this year, trough in a couple weeks at 370,000 or so, peak in 3Q at only 5670,000 or so. A million would be healthy/normal.
Available inventory is of course still the story. We're starting the year with just 419,000 homes one the market. Last year was 763,000. It wasn't that long ago when we'd start the year with 1 million or more active inventory. 1/5
New Years' is always the lowest listing volume and this year we're at just 23,000 new listings. That'll jump this week. Fingers crossed that inventory follows a more normal pattern this year so we can meet some of the demand out there. 2/5
US single family home prices ended 2020 up 10% over 2019. Unreal. Like all the booming financial markets, real estate remains unhindered by any pandemic negative impact. Keep an eye on the gray line here for the steep jump that'll happen next week.