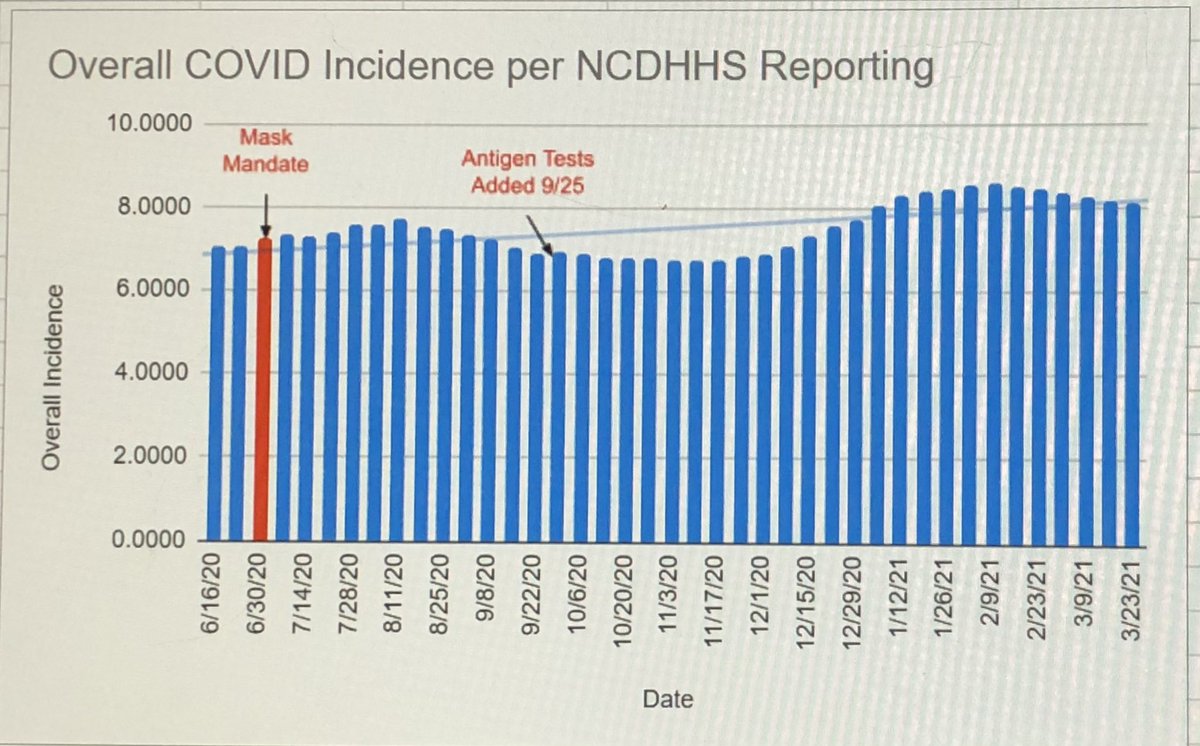
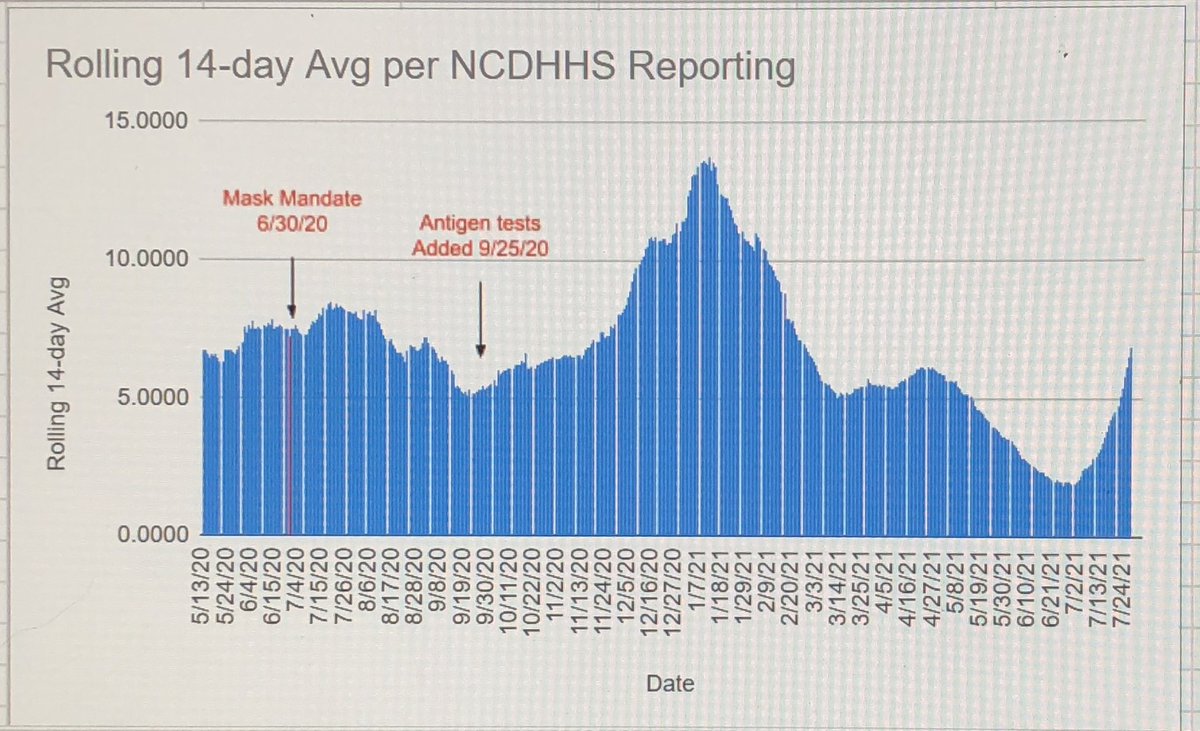
1/ @APDillon_ @jonpsanders @JohnLockeNC @markrobinsonNC @Chad_Adams NC C19 trends through 7/27/21. NCDHHS consistently modifies their dashboard (adds tests which ⬇️ incidence) and adds death data as far back as 6/20, & is no longer updating on weekends.
2/ Overall incidence is 7.26% and has never been at 5% since testing began; no statistically significant change since the mask mandate. Overall incidence 7/28/20: 7.56%, 7/27/21: 7.26% 

3/ Daily incid b/w 3.12% & 11.19% over last 14 days. Avg daily incid for 7/21 (5.2%) significantly <7/20 (8.1%). Avg daily incid: May: 6.8% June: 7.6% July 8.1% Aug 6.9% Sept 5.7% Oct 6.4% Nov 7.4% Dec 10.9% Jan 12.0% Feb 7.9% Mar: 5.4% Apr: 5.8% 5/21: 4.4%
6/21: 2.2% 7/21: 5.2%
6/21: 2.2% 7/21: 5.2%

4/ Avg wkly incid on 7/27 is 8.4%, is sig lower 7/21 (5.05%) vs 7/20 (8.11%), despite ⬆️d cases over last 2 wks. After mask mandate, avg wkly incid fluctuated sig despite reported mask compliance ~90%; over last 3 wks is 5.83%.
5/ Average weekly incidence each month:
May: 6.89% Jan: 12.41%
June: 7.40% Feb: 8.58%
July: 8.11% Mar: 5.50%
Aug: 7.38% Apr: 5.91%
Sept: 5.72% 5/21: 4.59%
Oct: 6.32% 6/21: 2.42%
Nov: 6.88% 7/21: 5.05%
Dec: 10.59%
May: 6.89% Jan: 12.41%
June: 7.40% Feb: 8.58%
July: 8.11% Mar: 5.50%
Aug: 7.38% Apr: 5.91%
Sept: 5.72% 5/21: 4.59%
Oct: 6.32% 6/21: 2.42%
Nov: 6.88% 7/21: 5.05%
Dec: 10.59%
6/ Rolling 14-day incid avg is 6.91% & is significantly lower for 7/21 (3.79%) vs 7/20 (7.95%) despite cases ⬆️ last 2 wks. After mask mandate, rolling 14-day incidence fluctuated significantly despite reported mask compliance ~90%.
7/ Rolling 14-day incidence average each month:
May: 6.66% Jan: 12.38%
June: 7.59% Feb: 8.87%
July: 7.95% Mar: 5.54%
Aug: 7.28% Apr: 5.82%
Sept: 5.91% 5/21: 4.78%
Oct: 6.15% 6/21: 2.50%
Nov: 6.95% 7/21: 3.79%
Dec: 10.21%
May: 6.66% Jan: 12.38%
June: 7.59% Feb: 8.87%
July: 7.95% Mar: 5.54%
Aug: 7.28% Apr: 5.82%
Sept: 5.91% 5/21: 4.78%
Oct: 6.15% 6/21: 2.50%
Nov: 6.95% 7/21: 3.79%
Dec: 10.21%
8/ Number of active cases (19,606) have ⬆️d over last 3 wks. C19 is seasonal (see curve); cases ⬆️d same time last year but difference is we are still averaging far fewer cases per day (997 for 7/21) vs last year (1859 for 7/30).
9/ Avg number of new cases/day each month:
May: 583 Jan: 7032
June: 1164 Feb: 3686
July: 1859 Mar: 1724
Aug: 1498 Apr: 1854
Sept: 1352 5/21: 1072
Oct: 2065 6/21: 357
Nov: 2996 7/21: 997
Dec: 5646
May: 583 Jan: 7032
June: 1164 Feb: 3686
July: 1859 Mar: 1724
Aug: 1498 Apr: 1854
Sept: 1352 5/21: 1072
Oct: 2065 6/21: 357
Nov: 2996 7/21: 997
Dec: 5646

10/ NCDHHS back fills test data over a month. # tests/month:
May: 271,133 Jan: 1,896,598
June: 348,174 Feb: 1,330,879
July: 714,289 Mar: 1,098,446
Aug: 699,911 Apr: 1,056,905
Sept: 773,697 5/21: 808,806
Oct: 1,037,783 6/21: 542,700
Nov: 1,242,860 7/21: 487,463
Dec: 1,673,424
May: 271,133 Jan: 1,896,598
June: 348,174 Feb: 1,330,879
July: 714,289 Mar: 1,098,446
Aug: 699,911 Apr: 1,056,905
Sept: 773,697 5/21: 808,806
Oct: 1,037,783 6/21: 542,700
Nov: 1,242,860 7/21: 487,463
Dec: 1,673,424
11/ % recovered is 96.8%, % active cases is 1.89%, % deaths (CFR) is 1.31%. Mortality rate is 0.129% and has remained steady for 5 wks. Average number of deaths per day is 3.86 for 7/21. This is significantly lower than 7/20 (25.86).

12/ Avg # deaths per day each month:
3/20: 0.80 12/20: 67.3
4/20: 14.4 1/21: 97.2
5/20: 18.1 2/21: 44.9
6/20: 15.4 3/21: 14.1
7/20: 21.3 4/21: 11.0
8/20: 28.3 5/21: 11.0
9/20: 28.1 6/21: 5.07
10/20: 29.5 7/21: 3.81
11/20: 37.5
3/20: 0.80 12/20: 67.3
4/20: 14.4 1/21: 97.2
5/20: 18.1 2/21: 44.9
6/20: 15.4 3/21: 14.1
7/20: 21.3 4/21: 11.0
8/20: 28.3 5/21: 11.0
9/20: 28.1 6/21: 5.07
10/20: 29.5 7/21: 3.81
11/20: 37.5

13/ 0-17 & 18-24 cohorts continue to comprise 12% & 14% of all cases respectively; this hasn’t changed since 8/2020 despite vax. 14% of NC COVID cases are in 65+ cohorts, 82% of all NC COVID deaths are in this cohort. 41.8% of NC C19 deaths have been in congregate settings.
14/ Hospitalizations have ⬆️d over last 2 wks to 1091; last year this time we had roughly 200 MORE hospitalizations. Reporting changed on 11/13, and there is no shortage of inpatient or ICU beds or vents.

15/ WCPSS continues to list cases only but fails to report student/staff census to demonstrate infection rates in schools. Data is incomplete but what little data is given, the vast majority of cases are suspected to have community transmission. #ContextMatters
16/ Covid cases per cohort ⬆️‘d across age groups this week. Main cohort drivers of Covid transmission are 25-49 yrs, 50-64 yrs, and then 18-24 yrs. Despite C19 vax rate, 18-64 yr cohort cases outnumber 2-17 cohort cases by a factor of 6.28.

17/ Overall, while daily, wkly, & rolling 14-day incidence have fluctuated, hospital census was at its highest when we averaged 7031 new cases/day in Jan ‘21. We are 7x lower than that currently.
18/18 While cases & hospitalizations have increased, the death rate is significantly lower now than it was a year ago. Essentially the hospitalizations and deaths have been decoupled. There is no need to have any new mandates or an EO. #UNMASKOURCHILDREN #FactsNotFear #ncpol

@threadreaderapp please unroll
Should say (1859 for 7/20).
• • •
Missing some Tweet in this thread? You can try to
force a refresh