Took me a sec to understand this one. Inverted yields calling for a top in ISM manufacturing numbers. When those yields are shifted forward 18 months.

Decent correlation.

1/
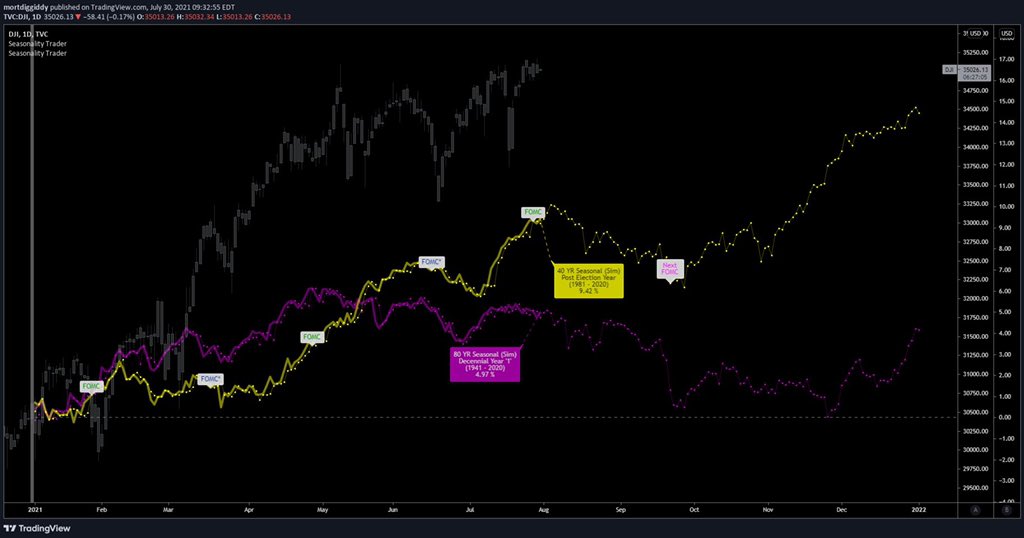
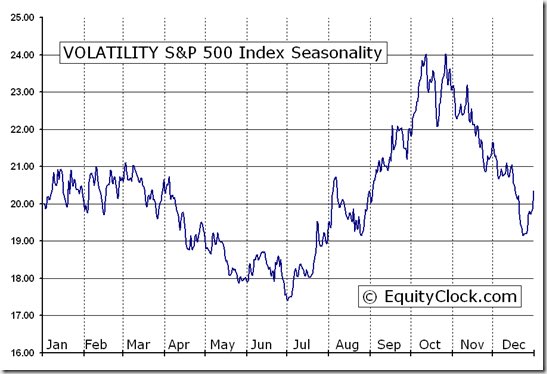
6/ There are a lot of correlations with manufacturing pointing to a slowdown in August - September.

This is in line with seasonal tops in decennial and election cycles for this time of year.

$SPY $QQQ $SPX $IWM $VIX $VXX $AMZN $GOOG $AAPL $DJI

• • •

Missing some Tweet in this thread? You can try to force a refresh
 

Keep Current with Cameron Osborne

Cameron Osborne Profile picture

Stay in touch and get notified when new unrolls are available from this author!

Read all threads

This Thread may be Removed Anytime!

PDF

Twitter may remove this content at anytime! Save it as PDF for later use!

Try unrolling a thread yourself!

how to unroll video
  1. Follow @ThreadReaderApp to mention us!

  2. From a Twitter thread mention us with a keyword "unroll"
@threadreaderapp unroll

Practice here first or read more on our help page!

More from @dailyEdgeGroup

16 Jul
Odds are, most will capitulate in the next 4 weeks if $SILVER decides to do the standard final flush before the big summer rally. It's happened before, it can happen again.

Look at 2005, 2006, 2010.

🧵

$GOLD #GOLD #SILVER $GLD $SLV $DXY $SPY $VIX $GDX $GDXJ $SILJ $DXY $USD
Typically gold and silver begin their summer rallies in June/July and last until late August to early September. 2020 was a good example of this.

US Dollars in post election years and years ending in -1 typically have a major top in the first half of July and descend into October.

Read 9 tweets
14 Aug 20
I like to drink bourbon and make crazy charts. I find it interesting that the year 1996 – 2004 rounded bottom is about the same length in total days as the 2011 – 2020 rounded bottom. From that bottom in 1999 we had a 662% increase that took 6 years once the breakout started $GLD Image
The correction in 2004 right after the breakout dropped gold a little less than 10%. The high was retested, and then it made another low to make a 13% correction.

When gold broke the 2011 high, we had about a 10% correction again.

$GLD $SLV ImageImage
Gold seasonality ends on SEP 2 on avg for the last 10 years. This “little” correction we have had is actually right on schedule. It is big yes, but that is a testament to the overbought level it reached. $GLD had a daily RSI reading of 90.5, a value only surpassed in 1999 of 92.1 Image
Read 5 tweets

Did Thread Reader help you today?

Support us! We are indie developers!


This site is made by just two indie developers on a laptop doing marketing, support and development! Read more about the story.

Become a Premium Member ($3/month or $30/year) and get exclusive features!

Become Premium

Too expensive? Make a small donation by buying us coffee ($5) or help with server cost ($10)

Donate via Paypal Become our Patreon

Thank you for your support!

Follow Us on Twitter!

:(