(づ。◕‿‿◕。)づ 🌊тнє 5тн ωανє ιѕ ¢σмιηg 🌊
⤷ And the Φ #GoldenRatio Φ plays a key role 👀
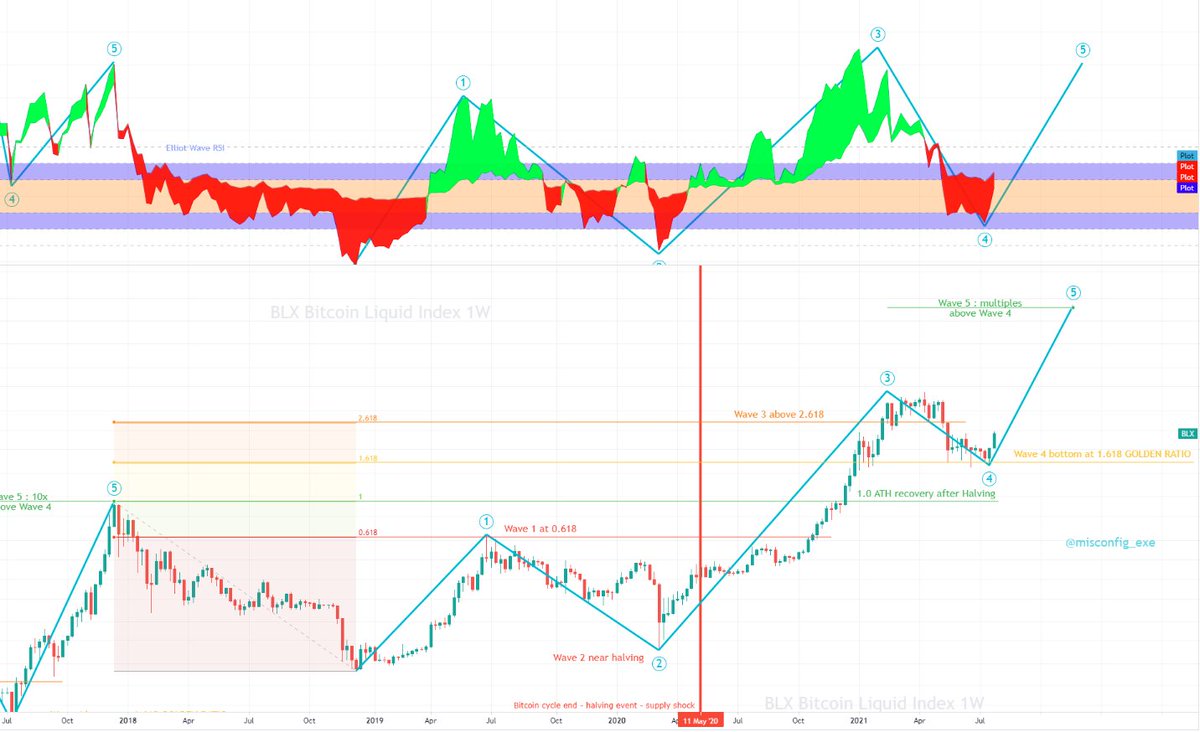
The #Bitcoin bull run is missing its 5th wave.
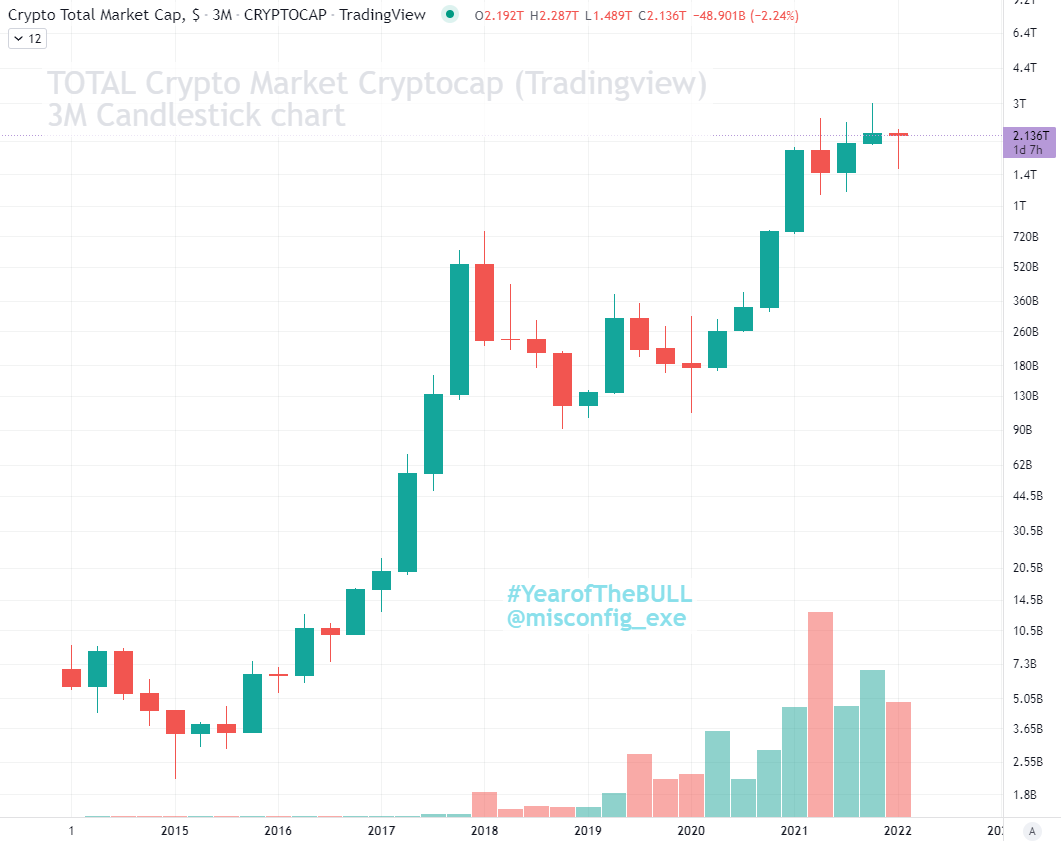
This final push will send #BTC and the $TOTAL #cryptocurrency market into 🚀MANIA🚀 mode.
Zooms and full analysis in following tweets
⤷ And the Φ #GoldenRatio Φ plays a key role 👀
The #Bitcoin bull run is missing its 5th wave.
This final push will send #BTC and the $TOTAL #cryptocurrency market into 🚀MANIA🚀 mode.
Zooms and full analysis in following tweets

#Bitcoin bull runs are composed of ↝ 5 Waves ↝
➚ Wave 1: finds resistance at 0.618 #GoldenRatio
➘ Wave 2: finds support near #BTC halving
➚ Wave 3: breaches above 2.618 Golden Fib level
➘ Wave 4: finds support at 1.618 #GoldenRatio
➚ Wave 5: tops out multiples above Wave 4


➚ Wave 1: finds resistance at 0.618 #GoldenRatio
➘ Wave 2: finds support near #BTC halving
➚ Wave 3: breaches above 2.618 Golden Fib level
➘ Wave 4: finds support at 1.618 #GoldenRatio
➚ Wave 5: tops out multiples above Wave 4


When you compare these to the psychological stages of a bubble applied to the long-term #Bitcoin chart, you can see that Wave 1
➚ ➘ Waves 1 and 2: Occur during STEALTH Phase
➚ ➘ Waves 3 and 4: Initiate and concludes the AWARENESS Phase
➚ Wave 5: is the MANIA Phase
➚ ➘ Waves 1 and 2: Occur during STEALTH Phase
➚ ➘ Waves 3 and 4: Initiate and concludes the AWARENESS Phase
➚ Wave 5: is the MANIA Phase

When comparing seasonality, we can see that the cyclical #Bitcoin bull run ➘ Wave 4 correction concludes with a Bullish Hammer Reversal Candlestick ➚ on the 1 Month chart
https://twitter.com/misconfig_exe/status/1421275796308578305
This July Bullish Hammer Reversal Candlestick ➚ means that H2 is the true #Bitcoin Mania phase
https://twitter.com/misconfig_exe/status/1423105719394471936
If you're not familiar with the #Bitcoin #GoldenRatio and the key support and resistance it plays, here is some information about the 1.618 level:
https://twitter.com/misconfig_exe/status/1405252683431178240
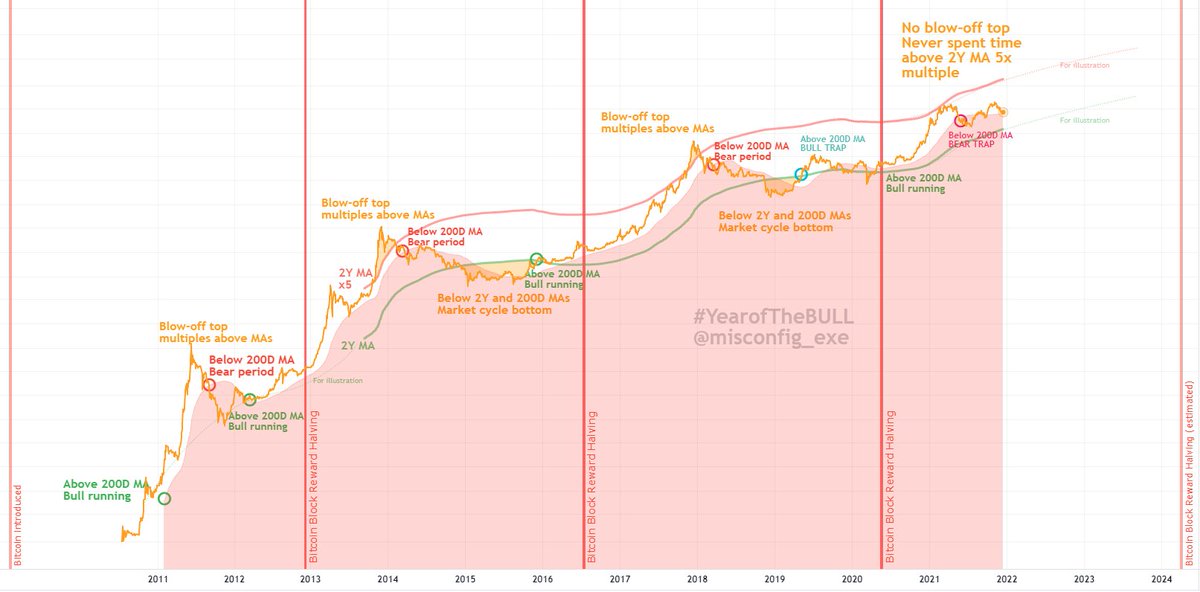
To those of you asking "when top"? The answer is: when mania is no longer sustainable.
I expect this to be above the 5X 2Y MA. See:
I expect this to be above the 5X 2Y MA. See:
https://twitter.com/misconfig_exe/status/1408544229173858305?s=19
Adding an LTC comparison to the cycle analysis ...
https://twitter.com/misconfig_exe/status/1431260006213509124
• • •
Missing some Tweet in this thread? You can try to
force a refresh


