Brief thread on real yields.

One of the questions I am asked often is what these very low real TIPS yields mean. Many tend to take them as signs of bad news for US growth. But is that read accurate? 1/4
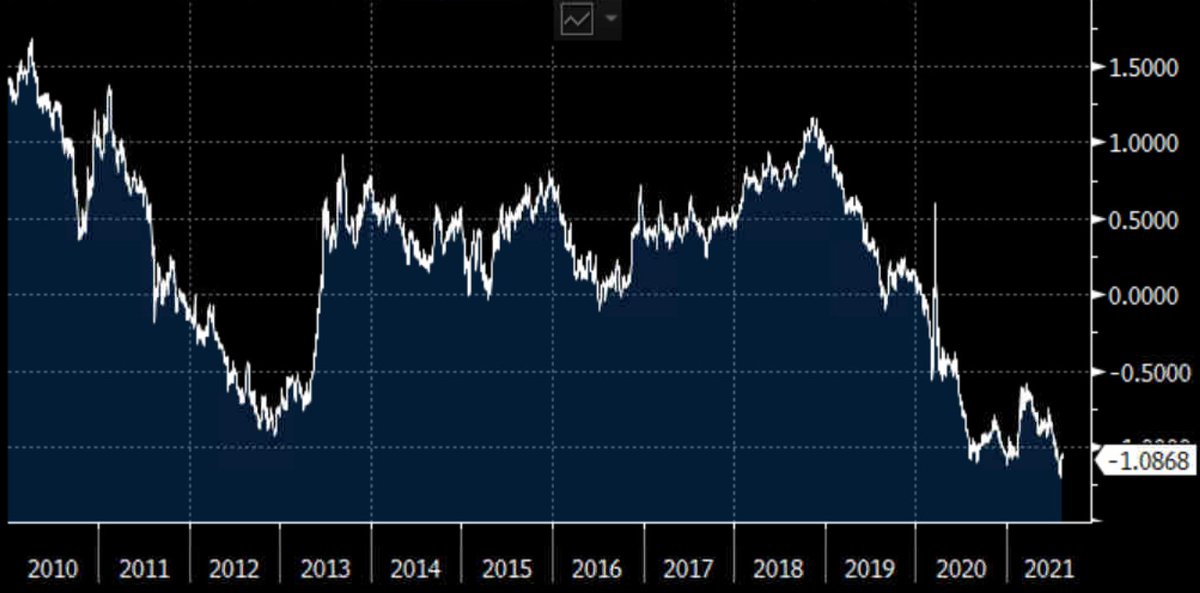
The problem is that there are other things that "contaminate" TIPS yields and that muddle the waters. Specifically, these things are risk premiums and liquidity premiums.

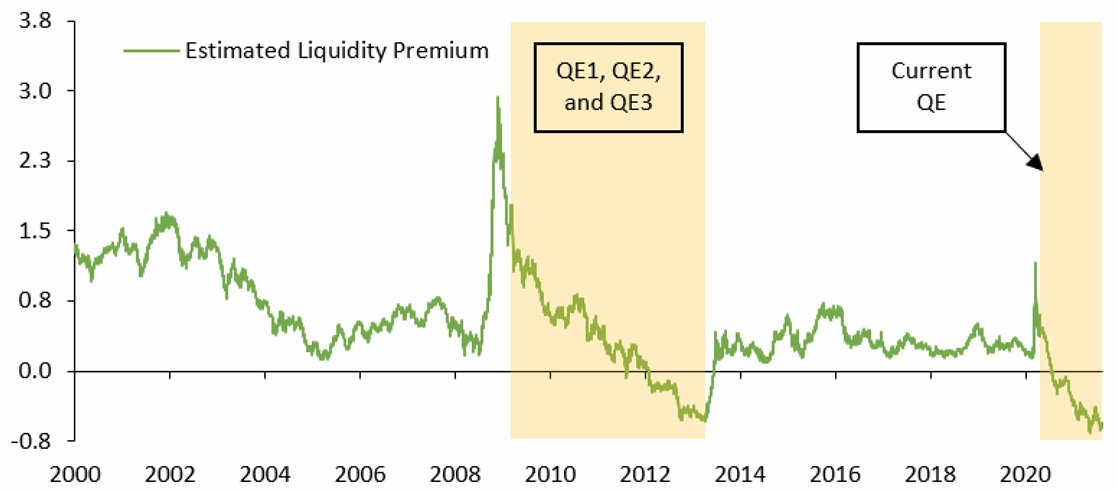
We can always express TIPS yields as follows (estimates from DKW). 2/4
Liquidity premiums, in particular, are estimated to be very low (close to record lows, in fact); they appear to have been the main drivers of TIPS yields in this Covid era. Coincidence of not, the last time they were so low was at the tail end of QE3. 3/4
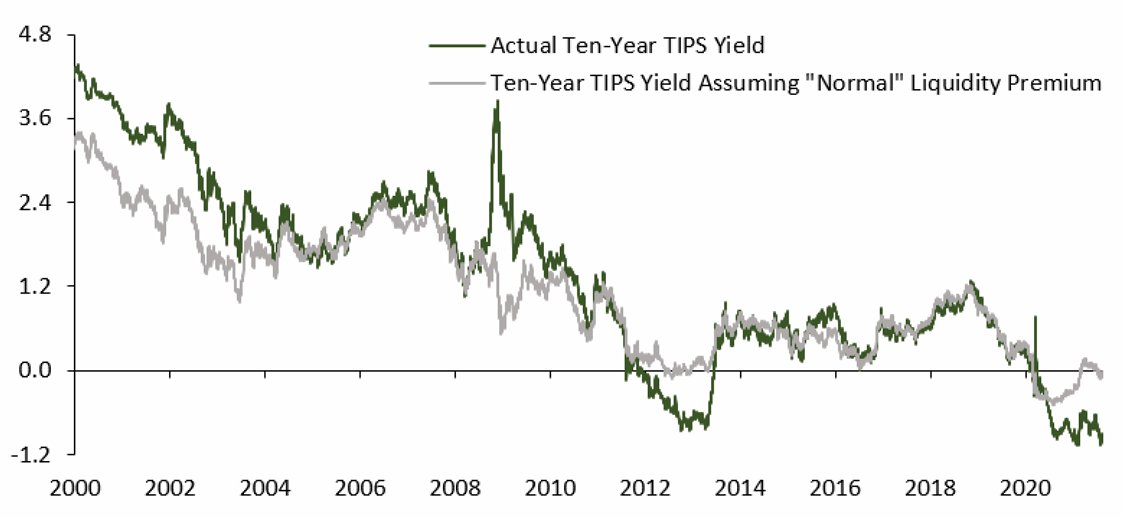
Assuming liq. premiums were "normal" (avg. of 2014-19), the resulting counterfactual 10 yr TIPS yield would be ~ 0, which is about where I would expect it to be at this stage of the cycle and with a low r*.

So, no bad news for growth; mostly just liquidity issues. 4/4

• • •

Missing some Tweet in this thread? You can try to force a refresh
 

Keep Current with Roberto Perli

Roberto Perli Profile picture

Stay in touch and get notified when new unrolls are available from this author!

Read all threads

This Thread may be Removed Anytime!

PDF

Twitter may remove this content at anytime! Save it as PDF for later use!

Try unrolling a thread yourself!

how to unroll video
  1. Follow @ThreadReaderApp to mention us!

  2. From a Twitter thread mention us with a keyword "unroll"
@threadreaderapp unroll

Practice here first or read more on our help page!

More from @R_Perli

20 Jul
Short thread.

The Treasury mkt continues to gyrate. It's interesting how momentous the June FOMC meeting was for the mkt. Since then:

1. The expected trajectory for the FFR rotated (higher rates in years 1-3, a lot lower after (i.e. the mkt doesn't believe in FAIT at all).
2. The market's estimate of the neutral rate (the expected FFR 7-10 years ahead) collapsed and continues to move down (left). Most of it is lower inflation expectations not lower expected real rates (right).
3. The drop in the market's view of neutral was within the bottom 5% of all one-month moves since 2007 (when our data begin). Only during the GFC, the European debt crisis, and the onset of Covid (March 2020) have we seen larger drops. It was that big.
Read 4 tweets
21 Jun
Brief thread to look at the damage that the FOMC meeting did to market expectations and the market outlook for the US economy.

Most people point to the sharp decline in 5Y fwd breakevens, which were approaching better levels and now are sinking. Yes, but there is more. 1/6
The market is 100% buying that the Fed will raise rates sooner and faster than previously thought (it always did, and even more so after the FOMC). Look at the higher expected trajectory for the FFR for the first four years. 2/6
But, looking again at the chart in the previous tweet, expectations five yrs ahead and beyond have moved *down*. The market thinks that, by being preemptive, the Fed won’t need to hike as much later. Basically, the market thinks the Fed has already abandoned FAIT. 3/6
Read 6 tweets
13 Apr
Thread: Interesting results from the NY Fed’s March surveys. Bottom line, the surveys confirm that the #Fed is getting only half of its message across to investors.

First, both primary dealers and market participants see high odds of early and fast liftoff. 1/6
Second, the odds of 2022 liftoff are about flat since December, but the odds of 2023 liftoff have increased to about 70%, according to primary dealers. A bit less according to broader market participants. 2/6
What is perplexing is that investors believe in early/fast liftoff despite seeing PCE inflation not even at target as a base case for the next 5 years or the subsequent 5 years.

Table shows PCE inflation translated from original CPI inflation in the surveys. 3/6
Read 6 tweets
19 Mar
1/8 This is a thread about whether Fed policy is really as easy and dovish as it seems and as the Fed intends it to be.

I would argue it is not, and not because the Fed doesn't want it to be, but because markets are skeptical of the new Fed's framework, as the chart shows.
2/8 Monetary policy works via financial markets, and financial markets price interest rates in part based on expectations of what the Fed will do in the future.

This year, markets have pushed up the expected path for the fed funds rate a lot, despite the Fed's reassurances.
3/8 That investors are not in sync with the Fed is also evident from surveys — see this thread for our @csmresearch recent survey of investors expectations and for how it is not consistent with the Fed’s intentions.
Read 8 tweets
16 Mar
1/5 As promised, here are the results of our survey of expectations ahead to tomorrow' #FOMC meeting.

Respondents see strong growth this year and (substantially less so) later. But they don't see either the labor market close to maximum employment or inflation overshooting. Image
2/5 This notwithstanding, 77% or respondents see the Fed raising rates before the end of 2013. I read this, coupled with the modest forecast for inflation, as a sign that investors do not fully believe that the Fed is committed to its new average inflation targeting framework. Image
3/5 To be sure, the median and average trajectories for the funds rate that respondents have in mind are not aggressive. But the seeming lack of confidence in the new framework should be concerning to the #Fed. Expect further attempts at (verbal only) clarification. Image
Read 5 tweets
19 Aug 20
1/10 This incorrect reading (summarized in the story below) of what’s going on in the TIPS market is pervasive these days.

Here is a refresher of how to interpret signals from the TIPS market (thread).

@LizMcCormickWV @ctorresreporter @jbensondurham

bloomberg.com/news/articles/…
2/10 The TIPS rate can be expressed as follows:

TIPS Rate =
Expected Average Real Fed Funds Rate +
Real Term Premium +
Liquidity Premium

The liquidity premium reflects normally lower liquidity in the TIPS vs nominal market (investors demand a premium to hold TIPS).
3/10 The breakeven rate can always be expressed as:

Breakeven Rate =
Expected Inflation +
Inflation Risk Premium -
Liquidity Premium

So, the liquidity *adds to* observed TIPS rates and *subtracts from* breakeven rates (that's b/c breakeven=nominal rate - TIPS rate).
Read 10 tweets

Did Thread Reader help you today?

Support us! We are indie developers!


This site is made by just two indie developers on a laptop doing marketing, support and development! Read more about the story.

Become a Premium Member ($3/month or $30/year) and get exclusive features!

Become Premium

Too expensive? Make a small donation by buying us coffee ($5) or help with server cost ($10)

Donate via Paypal Become our Patreon

Thank you for your support!

Follow Us on Twitter!

:(