As promised, here is a thread covering the Scottish covid-19 situation over the past week!
First some figures on cases, which are unfortunately still rising, and have started doing so at an increased rate in the past few days.
This is especially true in the 15-24 age range.
First some figures on cases, which are unfortunately still rising, and have started doing so at an increased rate in the past few days.
This is especially true in the 15-24 age range.


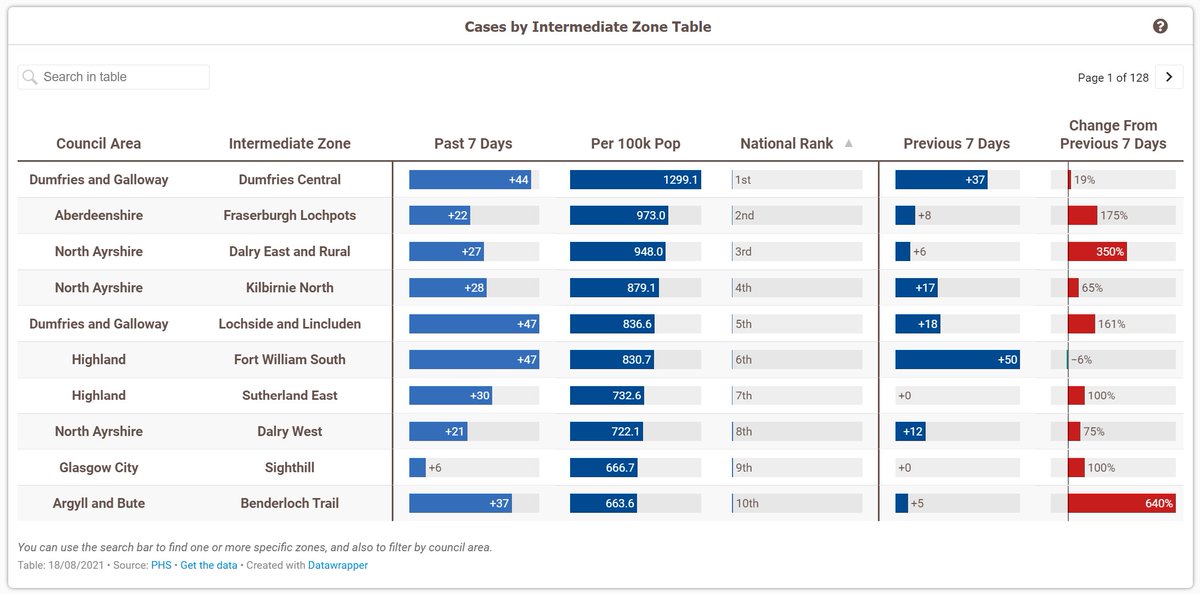
At a local level cases are rising nearly everywhere now, although the areas in Grampian are doing relatively well in comparison to the rest of the country.
Dumfries and Galloway currently have the highest 7 day case rate in Scotland, after a sharp increase during the past week.
Dumfries and Galloway currently have the highest 7 day case rate in Scotland, after a sharp increase during the past week.


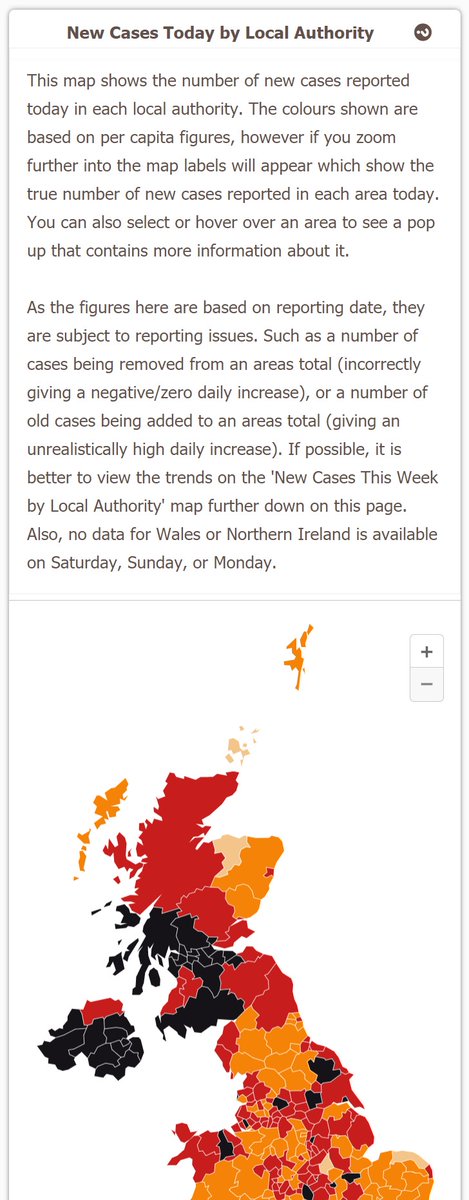
Scotland does still have the lowest 7 day case rate in the UK, although these figures do lag behind a little, so the increases seen in the past few days may not be fully reflected here yet.
Regardless, cases are rising across the UK, not just in Scotland.
Regardless, cases are rising across the UK, not just in Scotland.


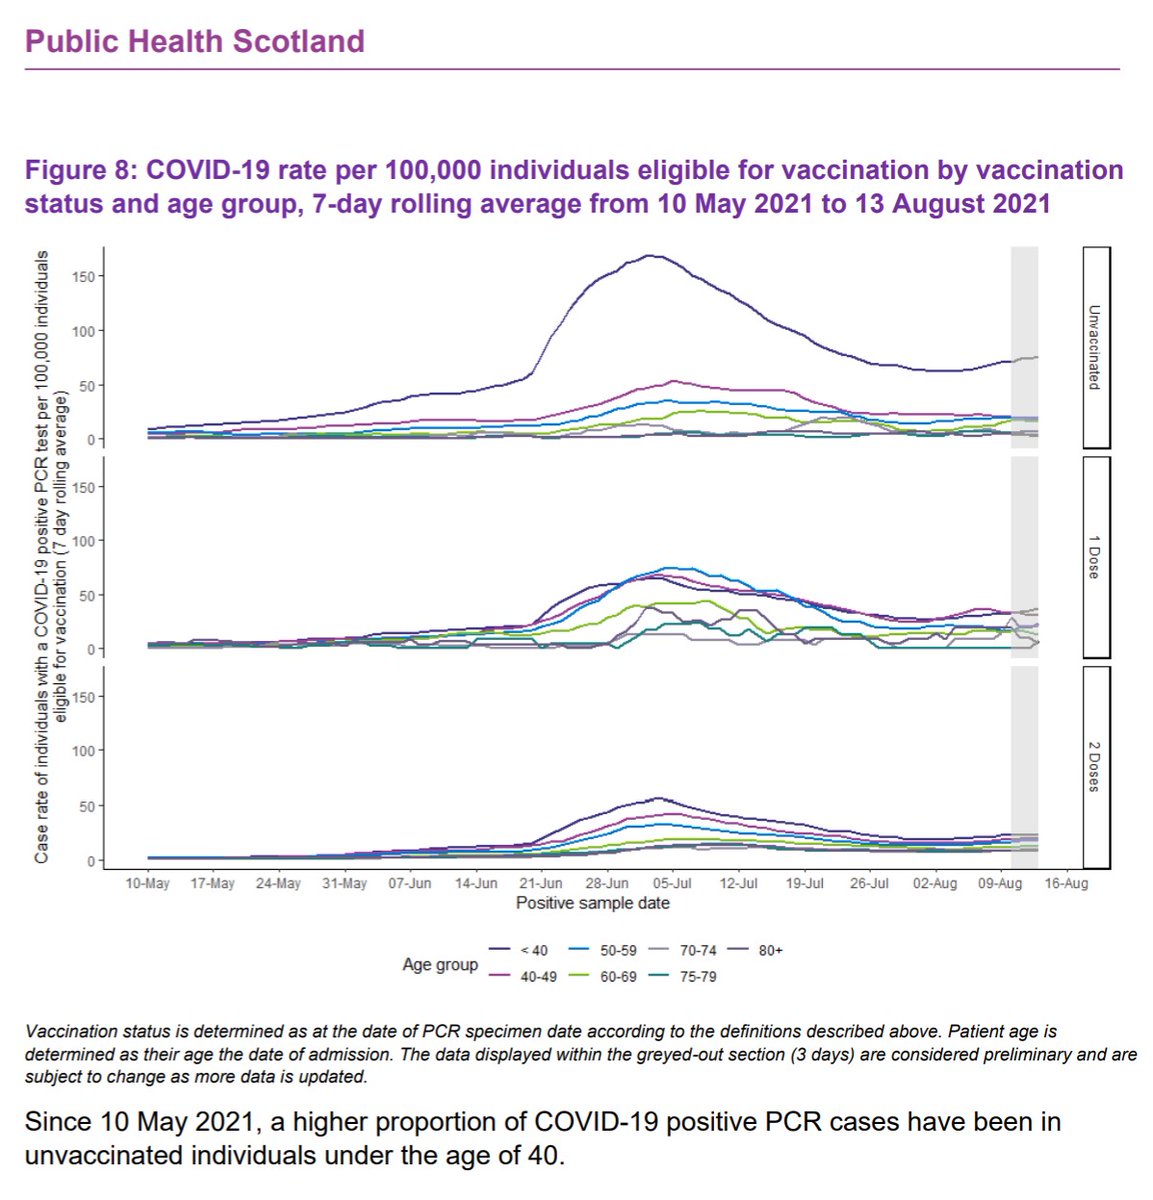
Then finally from the weekly PHS report (publichealthscotland.scot/media/8760/21-…), here are some figures on the vaccination status of the recent cases.
Unvaccinated people continue see far more cases than fully vaccinated people, adjusting for the population size of each group.
Unvaccinated people continue see far more cases than fully vaccinated people, adjusting for the population size of each group.


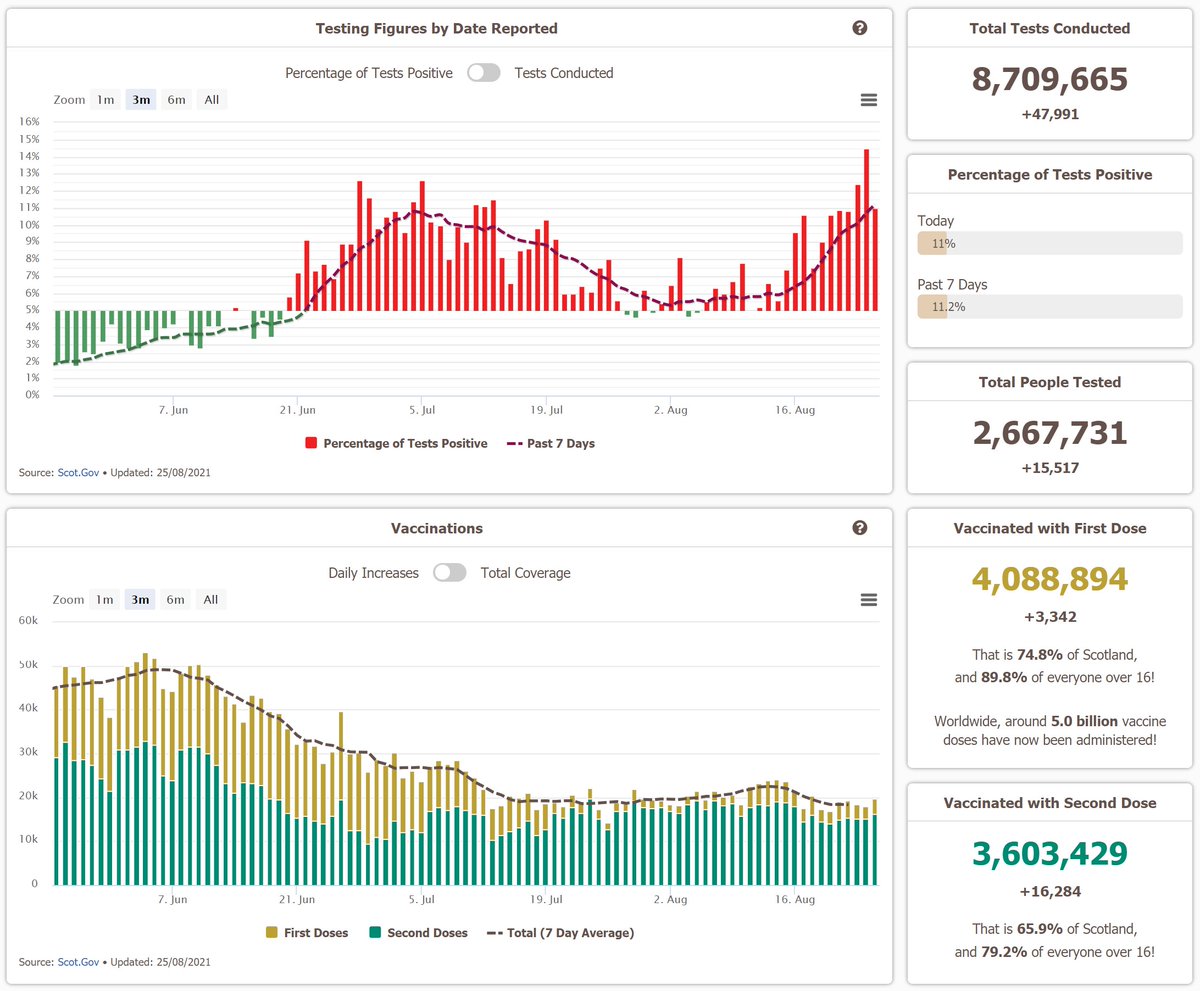
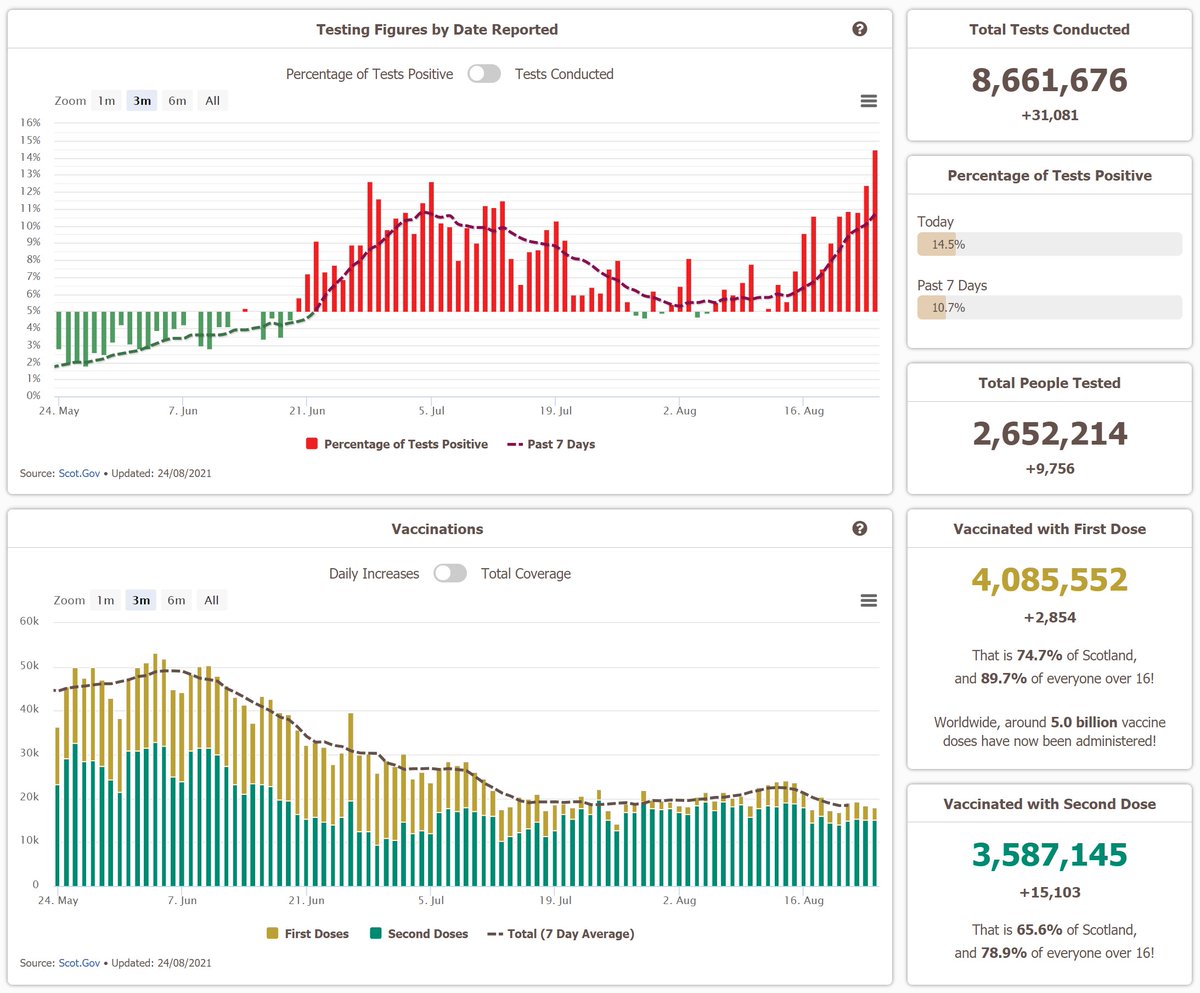
Testing is rising in Scotland, although cases are rising at a faster rate, resulting in the positivity rate going up. We were so close to getting below 5% on the 7 day rate too. 😞
Although some areas, including Aberdeen, do have a 7 day positivity rate of under 5%.
Although some areas, including Aberdeen, do have a 7 day positivity rate of under 5%.


In nicer news, deaths are declining at a more consistent rate now.
We're currently reporting an average of 5.7 new deaths a day, which is down from the recent peak of 8.4 new deaths a day.
We're currently reporting an average of 5.7 new deaths a day, which is down from the recent peak of 8.4 new deaths a day.


The situation across the UK is lagging a little behind Scotland in this regard, but hopefully UK wide deaths will peak soon too.
If not, then we will probably reach the point of averaging over 100 new deaths a day again throughout the UK sometime in the next week.
If not, then we will probably reach the point of averaging over 100 new deaths a day again throughout the UK sometime in the next week.


Also from the weekly PHS report, here is an update on deaths by vaccination status since the beginning of the rollout, and also the number of new deaths reported in the past week.
From the 6 new deaths reported in under 50s this week, not a single one was fully vaccinated.
From the 6 new deaths reported in under 50s this week, not a single one was fully vaccinated.


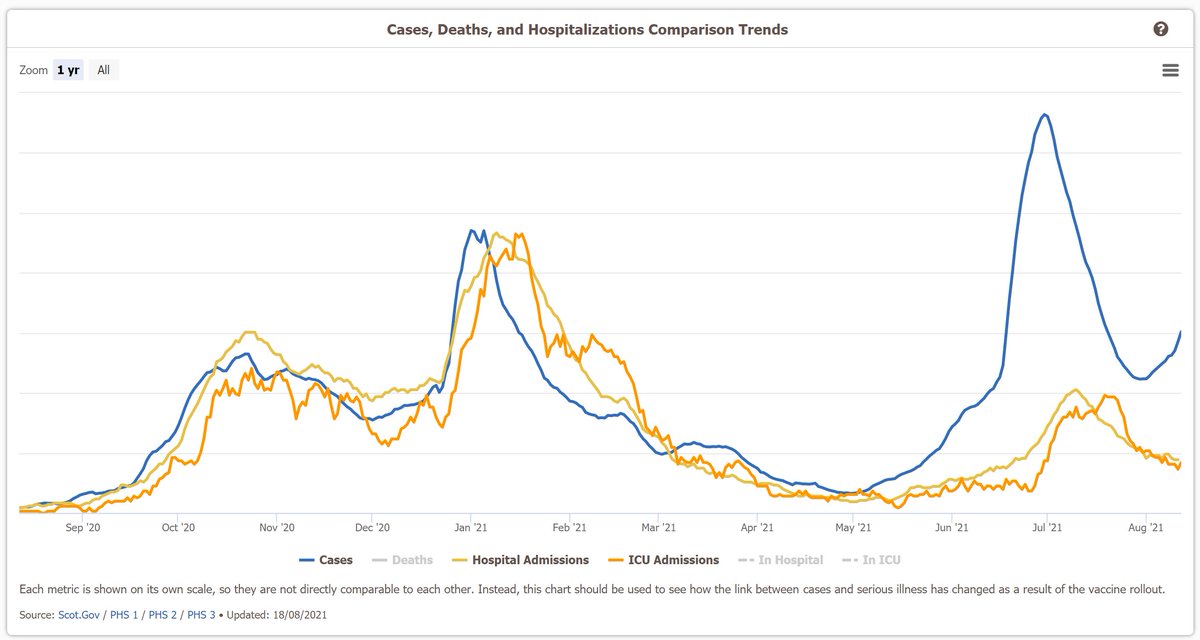
And here is this chart to show the effectiveness of the vaccines!
While our recent case peak was far higher than what we saw during January, the number of deaths which resulted from it didn't even nearly reach the levels we saw during January.
While our recent case peak was far higher than what we saw during January, the number of deaths which resulted from it didn't even nearly reach the levels we saw during January.

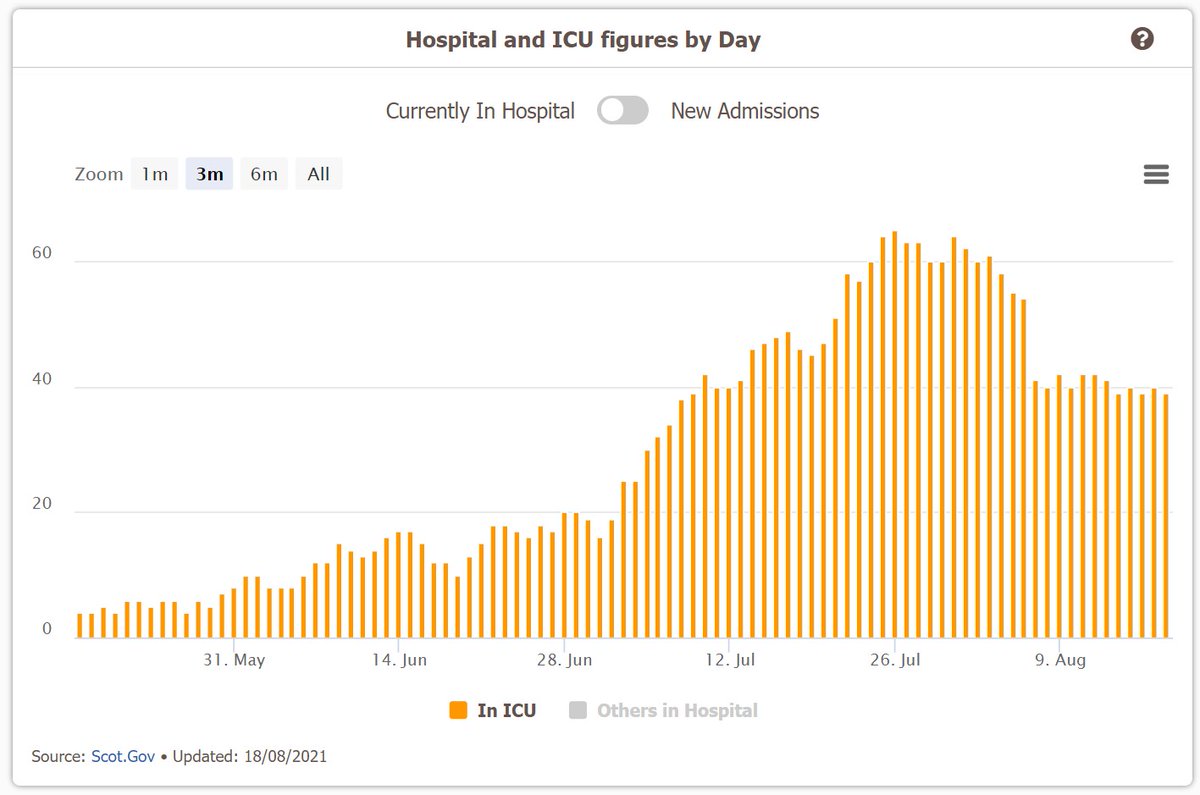
The number of hospital/icu inpatients and new admissions is up and down from day to day, but still generally on a downwards trend which is nice to see.


And some figures on the age and vaccination status of the recent hospital admissions!
About 60% of new unvaccinated covid related hospital admissions in the past month have been in people under the age of 40.
About 60% of new unvaccinated covid related hospital admissions in the past month have been in people under the age of 40.


And again a couple of these charts, showing the vaccine effect on hospitalizations!
The link here hasn't been weakened quite as much as it has with deaths, but it is still weakened by quite a bit.
The link here hasn't been weakened quite as much as it has with deaths, but it is still weakened by quite a bit.

And moving on to more positive news, vaccines! 🥳
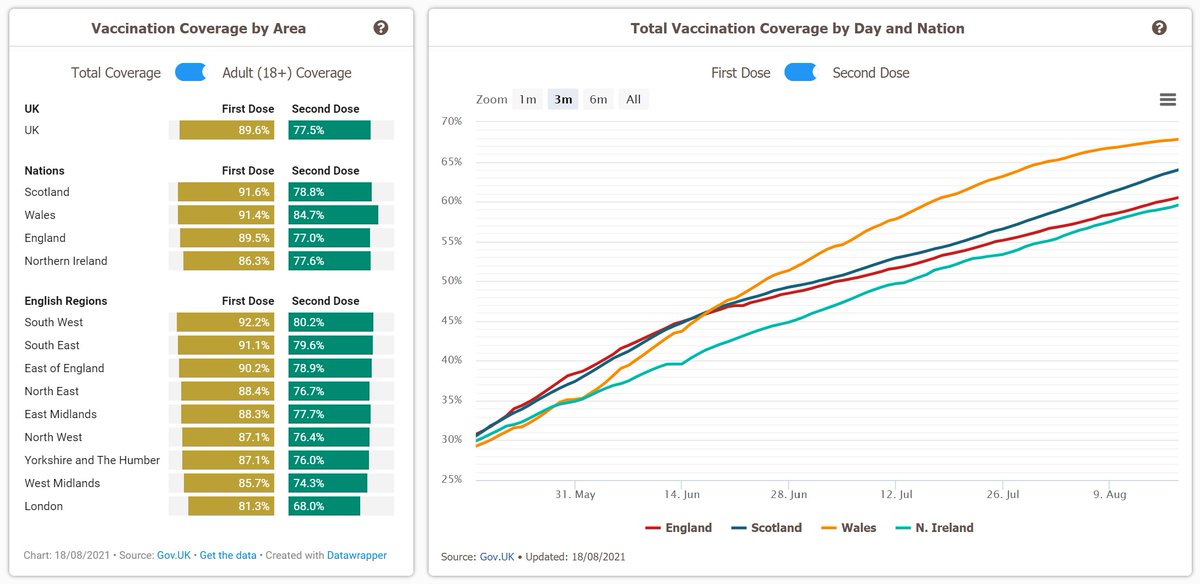
We're within touching distance of having 75% of the entire Scottish population partially vaccinated now. And 80% of the adult population are nearly fully vaccinated too!
We're within touching distance of having 75% of the entire Scottish population partially vaccinated now. And 80% of the adult population are nearly fully vaccinated too!


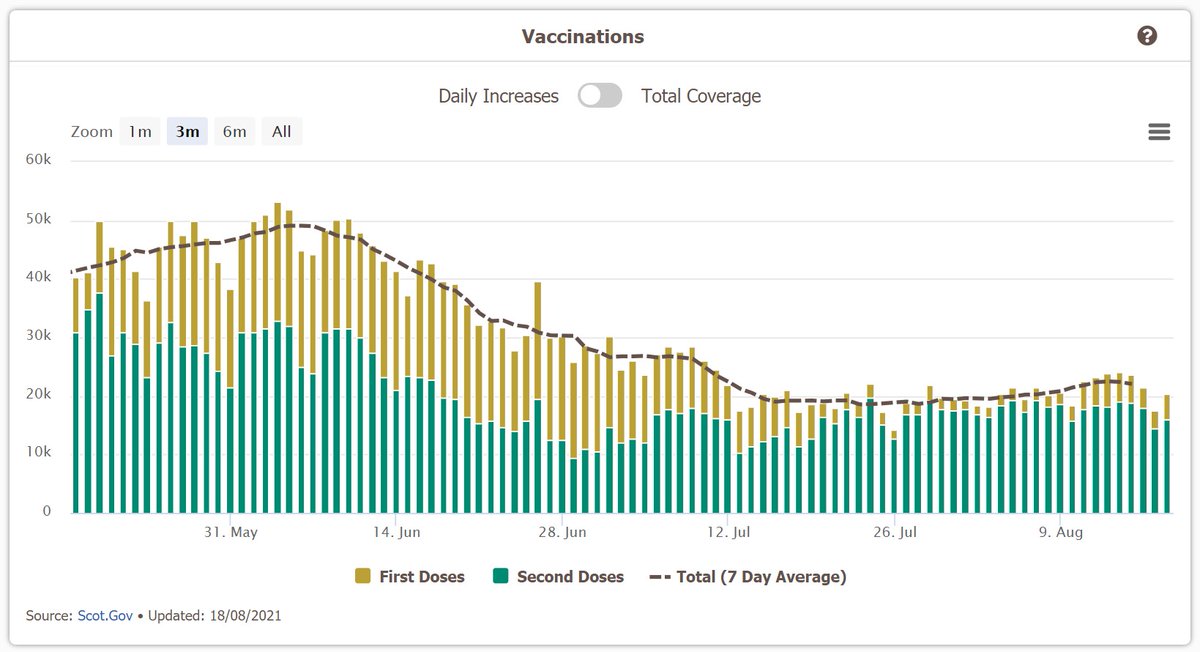
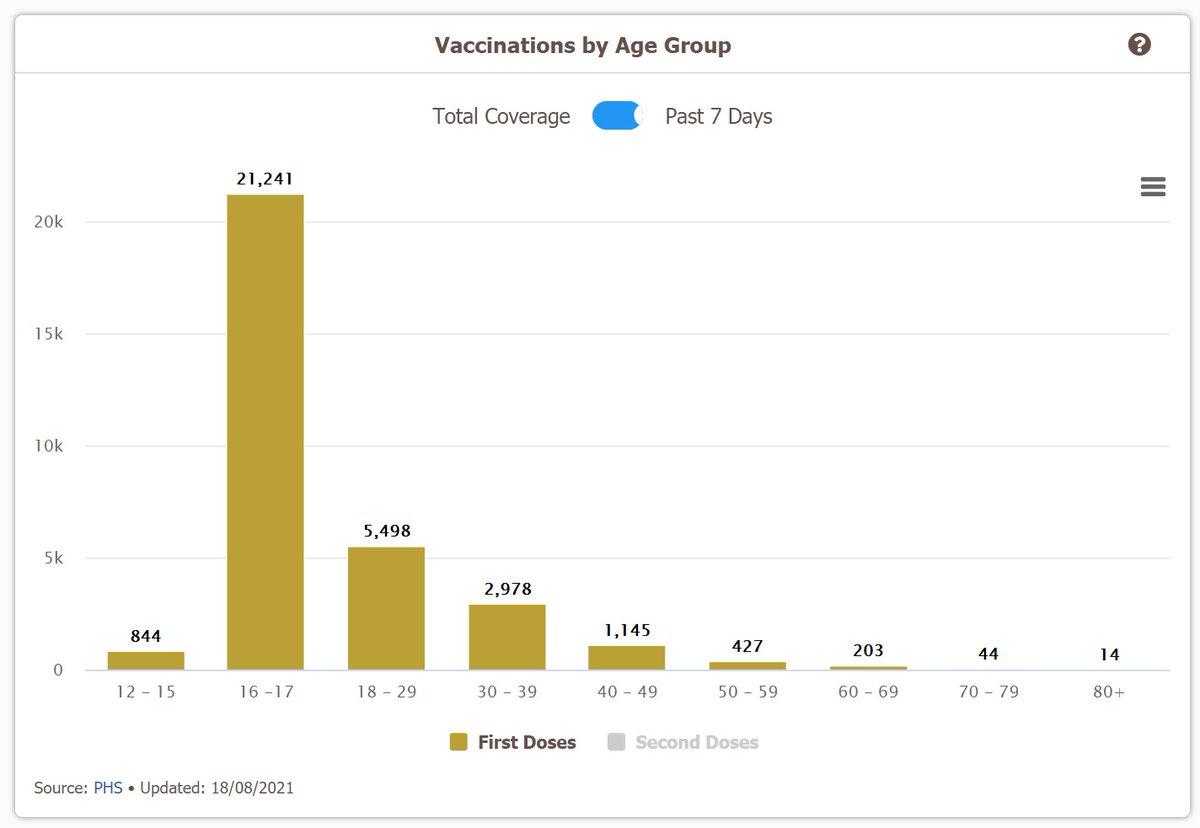
First doses saw a nice big jump recently, as we opened up eligibility to all 16/17 year olds.
Speaking of which, over 50% of that age group have now had their first dose of the vaccine! 🥳
And over 40% of at risk 12-15 year olds have now had their too.
Speaking of which, over 50% of that age group have now had their first dose of the vaccine! 🥳
And over 40% of at risk 12-15 year olds have now had their too.


Right now figures on the number of 16/17 year olds being vaccinated isn't actually being released, but I'm working them out by taking away the 18+ figure from the 16+ figure, to get the 16/17 figure.
However, they will start being officially released from tomorrow!
However, they will start being officially released from tomorrow!

I imagine the official figure will match mine, but I'll mention if it does not.
Also the changing around of the figures tomorrow might screw my update up, so just a heads up for that! Some of the vaccination charts might not be updated until I am able to get it all working again
Also the changing around of the figures tomorrow might screw my update up, so just a heads up for that! Some of the vaccination charts might not be updated until I am able to get it all working again
Anyways, second doses are still fairly unchanged.
We're still working our way through the 18-39 age range for the most part, meaning the vast majority of new doses administered in the past week have been Pfizer ones.
We're still working our way through the 18-39 age range for the most part, meaning the vast majority of new doses administered in the past week have been Pfizer ones.


At a local level, East Ayrshire has been administering the most doses over the past week.
I'll hopefully be able to start including 16/17 year old figures at a local level from tomorrow! But if so, it probably won't be done in time for the 3pm update.
I'll hopefully be able to start including 16/17 year old figures at a local level from tomorrow! But if so, it probably won't be done in time for the 3pm update.


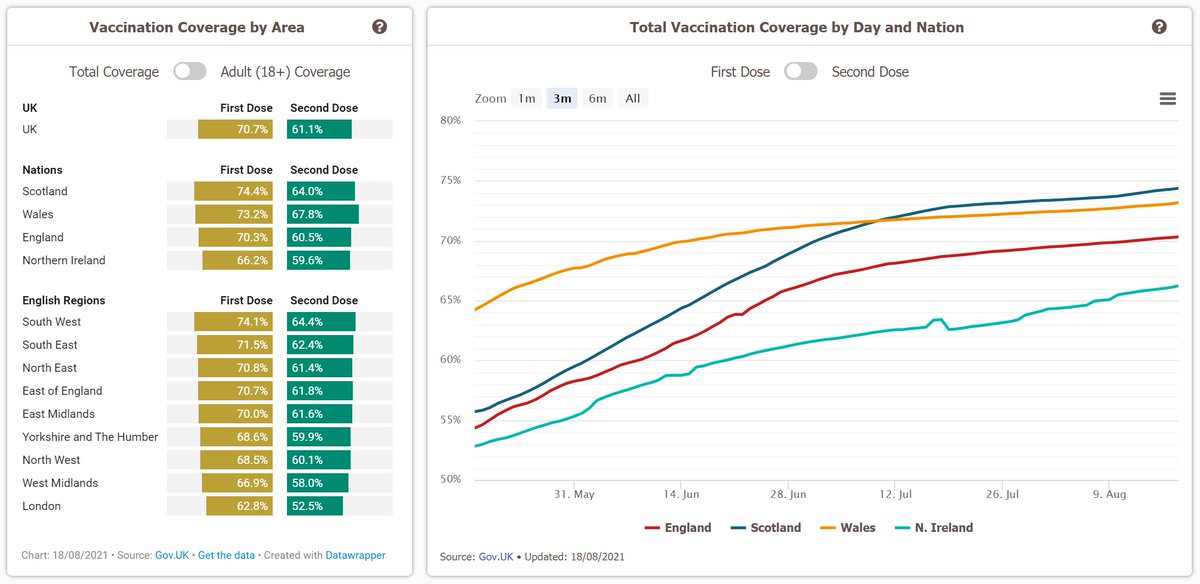
Then across the UK, Scotland are currently administering the most doses per capita, and are still ahead on total first dose coverage.
Although Wales are ahead on total second dose coverage, and also on total doses administered per 100 population.
Although Wales are ahead on total second dose coverage, and also on total doses administered per 100 population.


Internationally, we should reach 5 billion total doses administered sometime in the next week. 5 billion!! 💉🥳
Scotland has been knocked off the top of the leaderboard here though. Spain, Denmark, and Portugal have all now vaccinated more of their population than we have.
Scotland has been knocked off the top of the leaderboard here though. Spain, Denmark, and Portugal have all now vaccinated more of their population than we have.


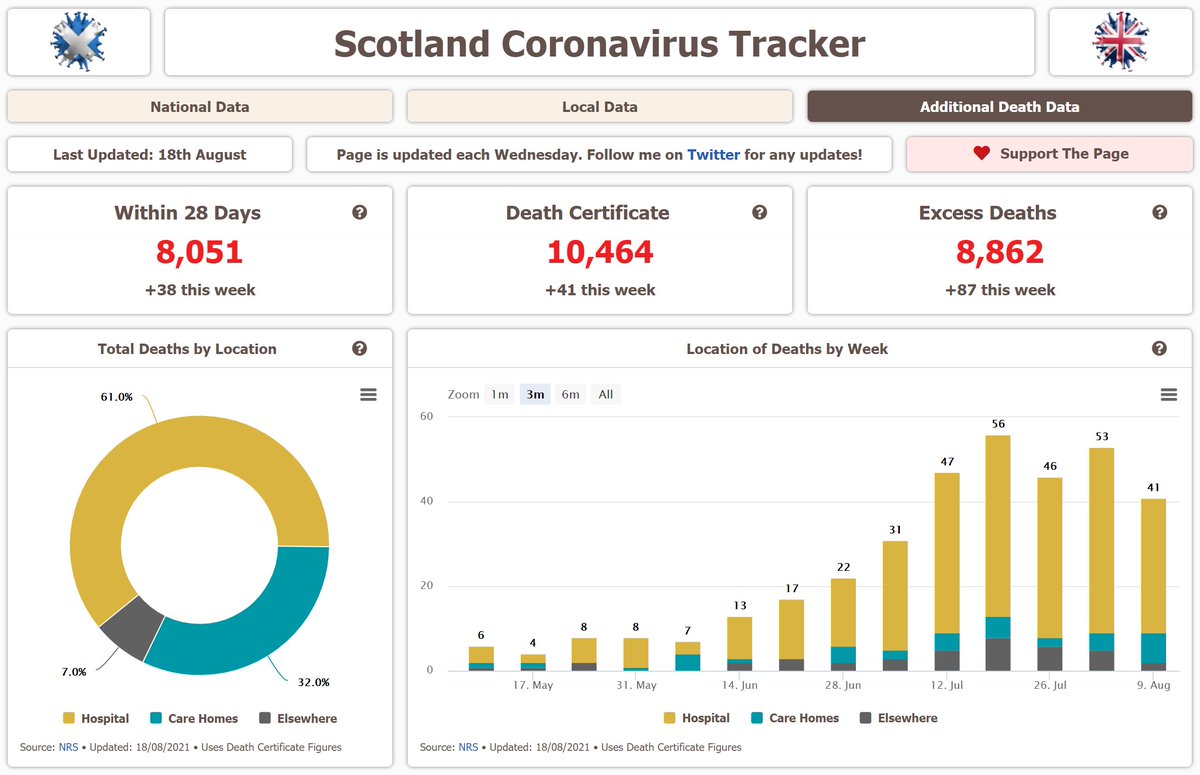
And lastly, here is an update on the weekly NRS death figures. 41 new deaths were reported this week, which is thankfully down from the week before.
Although excess deaths were up a little, and were above the normal range for the 12th week in a row.
Although excess deaths were up a little, and were above the normal range for the 12th week in a row.


The monthly detailed NRS report (nrscotland.gov.uk/files//statist…) was also released today!
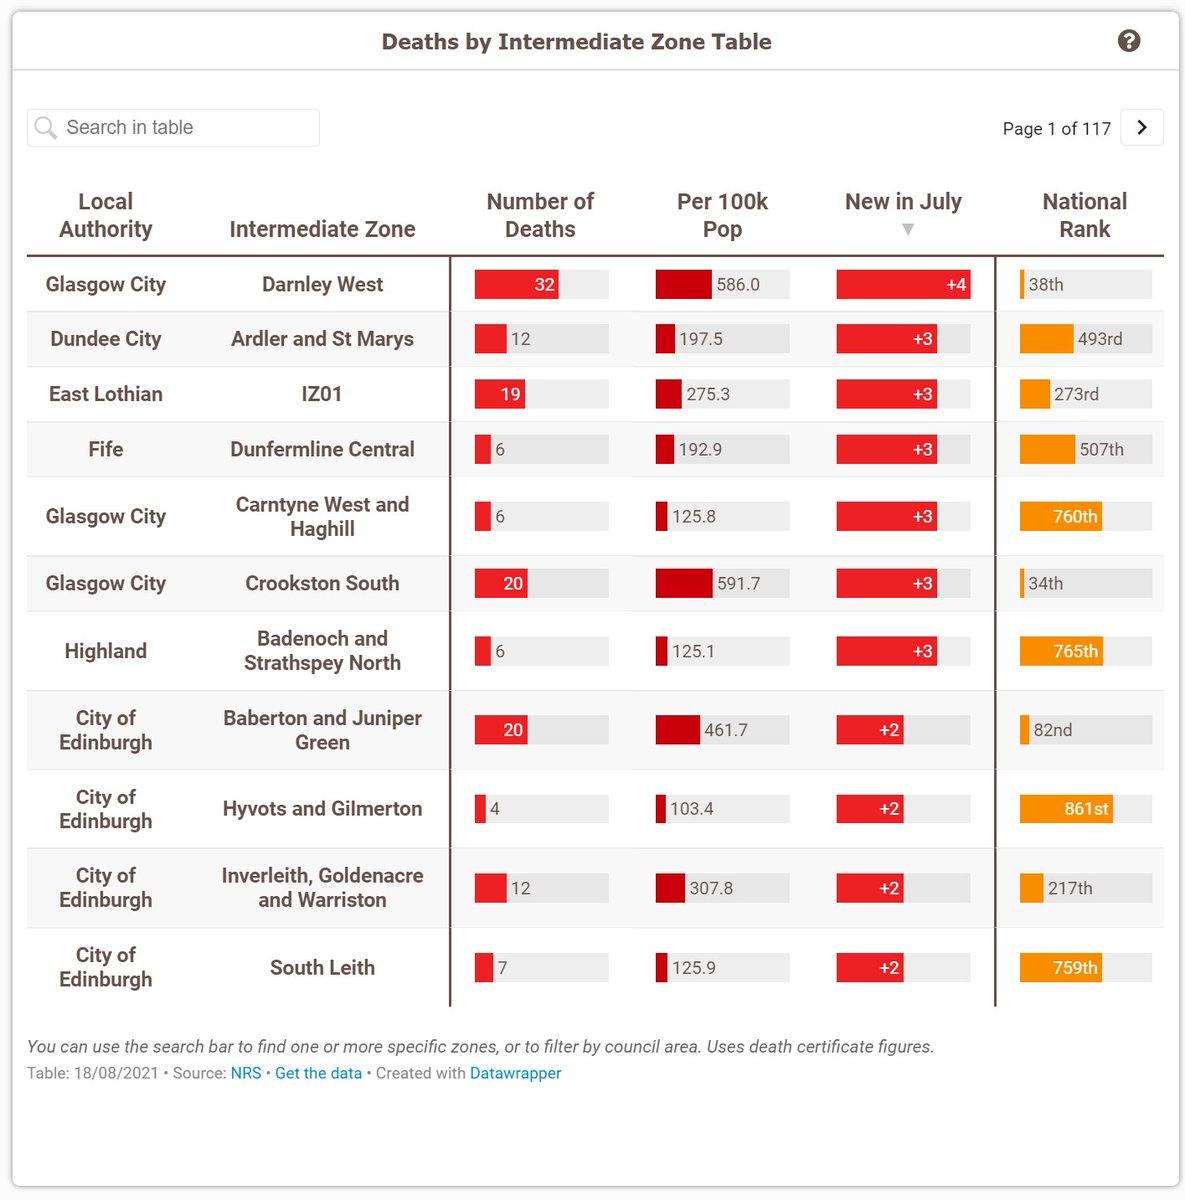
Some interesting figures are included with it, including an update on deaths by intermediate zone throughout July. I put a little map together to try and show them, but they're also in the table.
Some interesting figures are included with it, including an update on deaths by intermediate zone throughout July. I put a little map together to try and show them, but they're also in the table.


Also updated in the NRS report were these figures, showing deaths related to covid and the vaccinations.
I put a little table together to show the increases since last month too. Thankfully no new deaths due to an adverse reaction to the vaccine occurred in July.
I put a little table together to show the increases since last month too. Thankfully no new deaths due to an adverse reaction to the vaccine occurred in July.


So just for context, about 680,000 new vaccine doses were administered in July, resulting in 0 deaths. And about 60,000 new cases of the virus were confirmed in July, resulting in 199 deaths.
Anyways that is all!
Sorry I've shared this so late. I spent about half an hour working on the thread and then accidently deleted it, so I had to start again 😭😭
Sorry I've shared this so late. I spent about half an hour working on the thread and then accidently deleted it, so I had to start again 😭😭
I feel kind of deflated seeing the case rates rise again.
Maybe I was too optimistic, but I really thought once we'd vaccinated most people cases and deaths and hospitalizations would drop to near zero.
Maybe I was too optimistic, but I really thought once we'd vaccinated most people cases and deaths and hospitalizations would drop to near zero.
I mean we've 'only' fully vaccinated 64% of the country, so we can still go higher.
Up to 74% once everyone with their first dose gets their second, and even up to 83% if everyone currently eligible gets theirs (unlikely to happen).
So maybe we will get there one day!
Up to 74% once everyone with their first dose gets their second, and even up to 83% if everyone currently eligible gets theirs (unlikely to happen).
So maybe we will get there one day!
Its just disheartening to see case rates so high when most people should have some form of past immunity or vaccine protection by this point
I'm increasingly worried that we're just heading for an 'acceptable deaths' outcome rather than an outcome where we fully beat the virus
I'm increasingly worried that we're just heading for an 'acceptable deaths' outcome rather than an outcome where we fully beat the virus
But I guess as more people get infected and more people get vaccinated they do build better immunity, so maybe we've just got to wait a while longer to see a form of herd immunity kick in.
Hopefully it does come, and ideally it gets here by winter!
Hopefully it does come, and ideally it gets here by winter!
More so than the 'acceptable deaths' I'm worried about hospitalizations. The vaccines don't seem to be quite as effective at preventing those (although still very effective).
How does the NHS cope with a potential winter covid surge in addition to the flu and other pressures?
How does the NHS cope with a potential winter covid surge in addition to the flu and other pressures?

That is the only way I see us going back into another lockdown.. if cases surge over winter and the NHS can't cope with the additional pressure.
Anyways I'll stop with my what-ifs and worries. That is a job for someone who is smarter and who knows better 😅
Anyways I'll stop with my what-ifs and worries. That is a job for someone who is smarter and who knows better 😅
• • •
Missing some Tweet in this thread? You can try to
force a refresh