travellingtabby.com/uk-coronavirus…
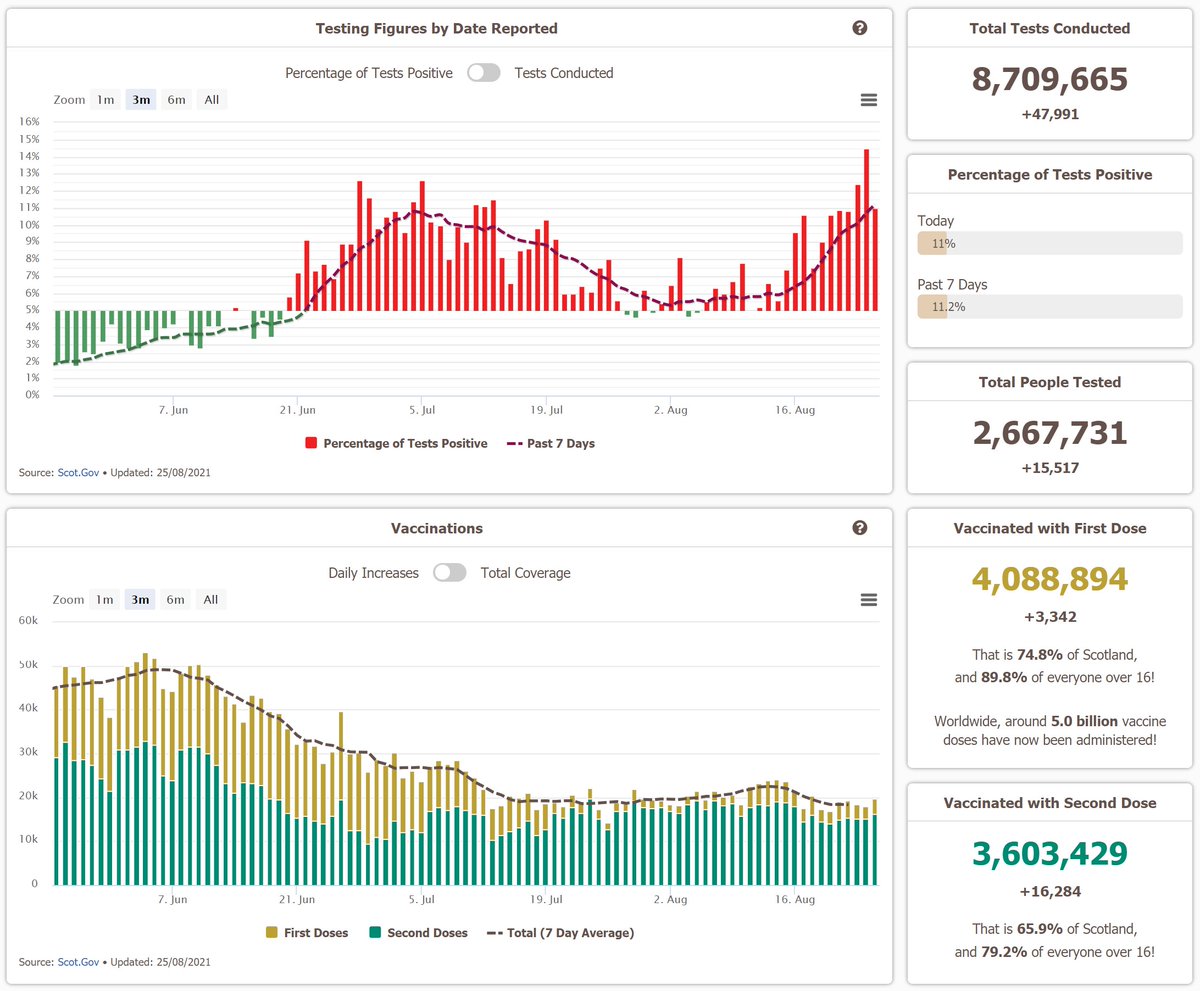
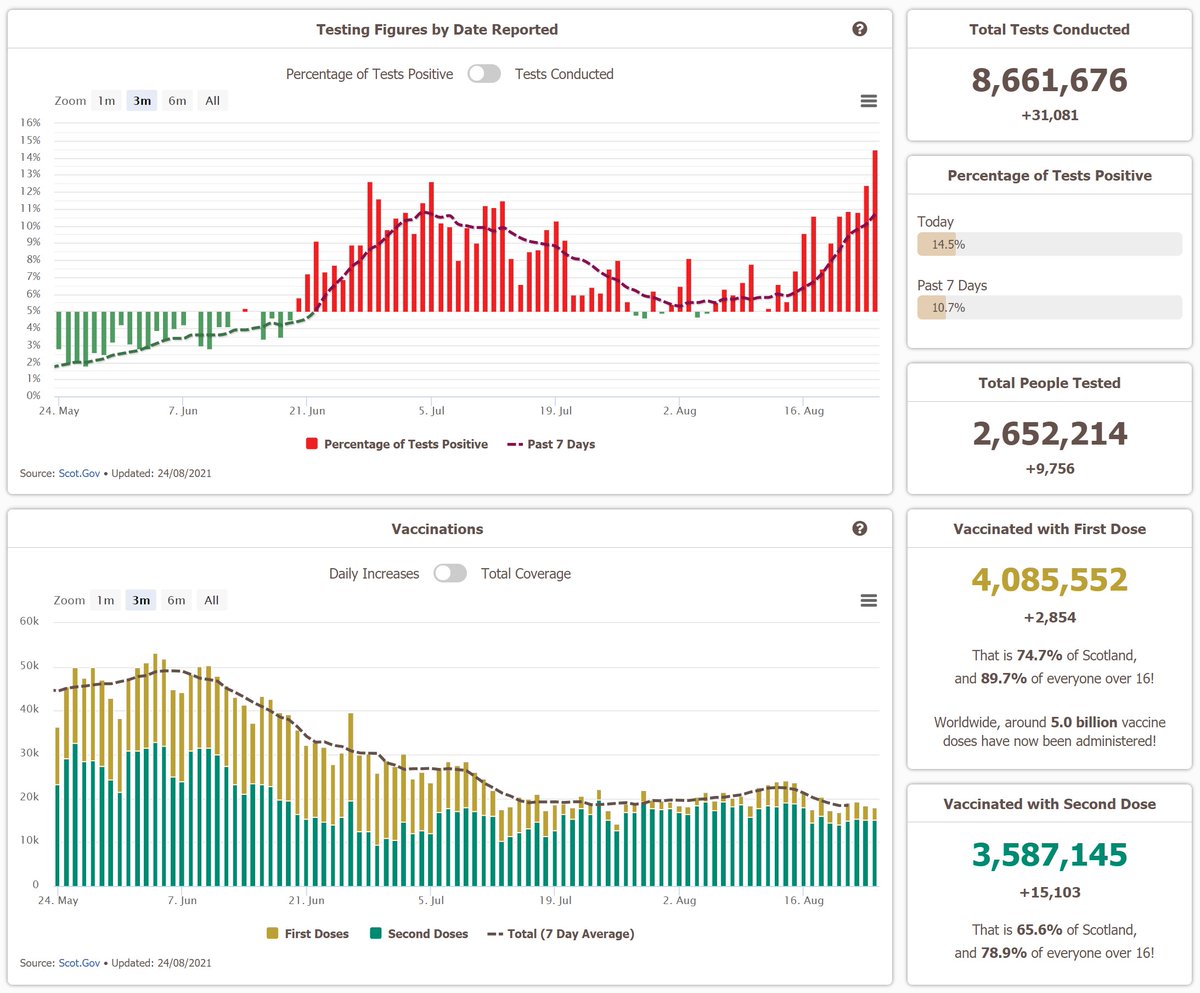
Over 5 billion vaccinations have now been administered across the planet! 🥳💉💉💉💉💉
That accounts to about 25% of the worlds entire population now being fully vaccinated, and another 8% partially vaccinated
#Covid19UK #coronavirusuk #DailyCovidUpdate


Over 5 billion vaccinations have now been administered across the planet! 🥳💉💉💉💉💉
That accounts to about 25% of the worlds entire population now being fully vaccinated, and another 8% partially vaccinated
#Covid19UK #coronavirusuk #DailyCovidUpdate


Here are some more figures on the global vaccinations!
As expected, the rollout has not been equal. Europe for example has fully vaccinated nearly half of its entire population, whereas Africa is on just 3%.
And nearly 2 of those 5 billion vaccinations have been in China alone!


As expected, the rollout has not been equal. Europe for example has fully vaccinated nearly half of its entire population, whereas Africa is on just 3%.
And nearly 2 of those 5 billion vaccinations have been in China alone!


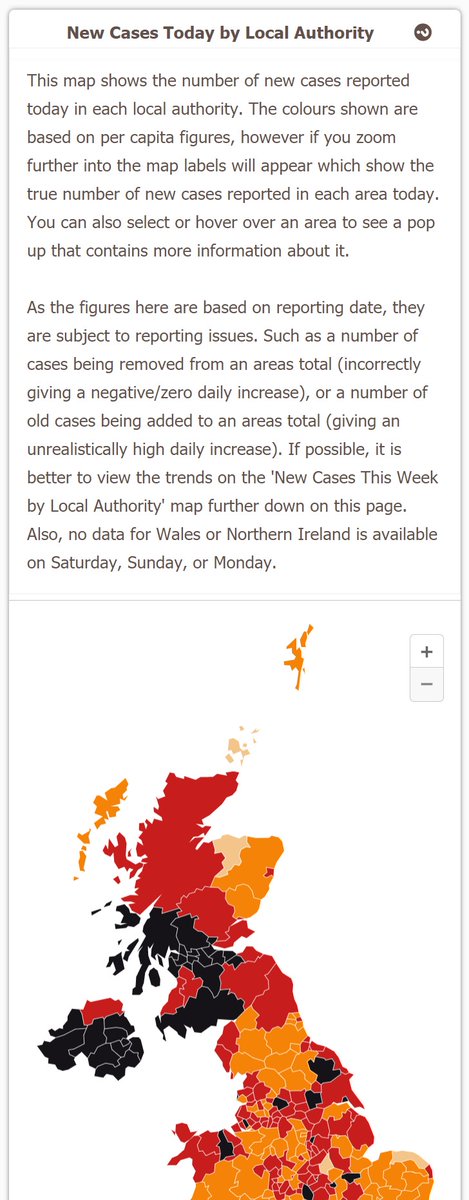
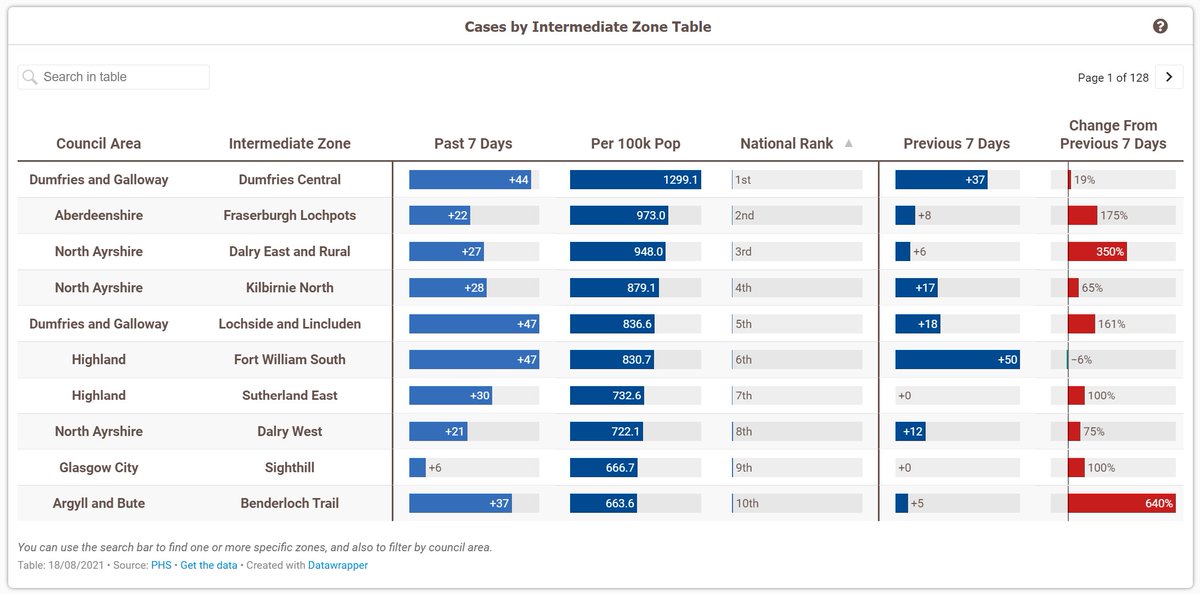
Also, I've changed these charts on the UK local page.
In addition to some design changes, the scales on the map have been updated to account for the rising cases, and the popups on it now give more information
On the table, you can now search for 'cities' to see just those!


In addition to some design changes, the scales on the map have been updated to account for the rising cases, and the popups on it now give more information
On the table, you can now search for 'cities' to see just those!


Maybe it won't show all cities (as it is surprisingly hard to make a list of all the cities in the UK), but it should still show most of them and can be handy for a quick comparison.
• • •
Missing some Tweet in this thread? You can try to
force a refresh


