Going to do a quick thread with a first look at what new state-level July data tells us about the impact of cutting UI benefits.
Context:
Key caveat here: The state-level data is noisy, and there are a LOT of differences between these states, both in general and in how they've responded to the pandemic in particular. So it's not easy to design a clean experiment here.
That said: It sure doesn't look like there's been a big jump in employment in the states that cut benefits so far. A few charts:
CORRECTION: Deleting charts because I reversed my code in a very stupid and embarrassing way. Will replace shortly. The basic takeaway in the tweet above does not change, however.
First off, here's change in employment since April, before states began announcing they were cutting UI. The states keeping benefits have actually seen slightly *faster* growth, although the difference is statistically insignificant.
(Note: corrected chart) Image
Note: I'm breaking states here into two groups, those that cut all federal benefits by early July and those keeping them all until next month. I'm dropping states that are only cutting some benefits, or where cutoffs are tied up in court.
The confusion around school reopening has messed with seasonal adjustment, and may have affected states differently. So it makes sense also to look at private-sector data (not affected by public education).
Here we see essentially zero difference between the states. Image
Now, benchmarking to April may not be entirely fair. The cutoff states may already have been further ahead in their recoveries, or not have had as much ground to make up.
This chart shows the states benchmarked to their prepandemic employment -- you can see that the cutoff states never fell as far initially, and so don't have as far to climb. But not much evidence the relationship has changed since they started cutting benefits. Image
By the way, not much difference if we look at states cutting ANY benefits -- i.e. adding back the states I dropped from my earlier charts. Image
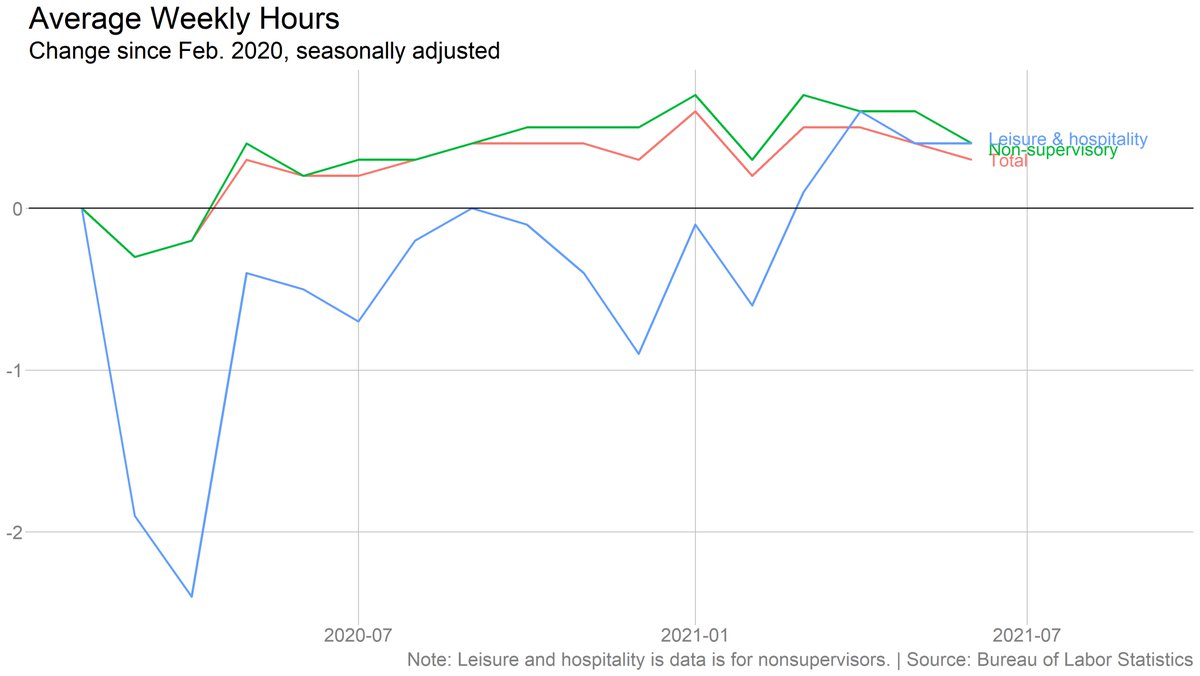
I thought we might see more impact in leisure and hospitality, specifically, since those workers are likely to be most affected by the benefits cutoff (and those sectors are dealing with so many hiring challenges). But it's the benefits-keeping states that are pulling ahead. Image
Thanks to @p_ganong for helping me think all this through, and for helping with the standard error calculations. All mistakes, including boneheaded label-switching in (since deleted) charts, are my own.

• • •

Missing some Tweet in this thread? You can try to force a refresh
 

Keep Current with Ben Casselman

Ben Casselman Profile picture

Stay in touch and get notified when new unrolls are available from this author!

Read all threads

This Thread may be Removed Anytime!

PDF

Twitter may remove this content at anytime! Save it as PDF for later use!

Try unrolling a thread yourself!

how to unroll video
  1. Follow @ThreadReaderApp to mention us!

  2. From a Twitter thread mention us with a keyword "unroll"
@threadreaderapp unroll

Practice here first or read more on our help page!

More from @bencasselman

9 Aug
Job openings hit a new record in June, but crucially, hires *also* rose. Suggests employers are finding a way through the labor logjam. #JOLTS
bls.gov/news.release/e…
Different story in leisure and hospitality, however, where openings were up again but hiring was flat (though still high by historical standard, consistent with what we saw in the monthly jobs reports).
It's a good time to be looking for a job (and a hard time to be trying to hire): There was just under 1 unemployed worker for every job opening in June. (Note that this adjusts for workers misclassified as "employed," though not for people who have left the labor force.)
Read 5 tweets
29 Jul
U.S. gross domestic product rose 1.6 percent in the second quarter (6.5 percent annualized), bringing inflation-adjusted output back to prepandemic levels. But the recovery is far from complete.
nytimes.com/2021/07/29/bus…
Note that returning to prepandemic peak does not mean that we're back to where we would have been without the pandemic at all. We've missed out on a year of economic growth.
After the last recession, it took two years for G.D.P. to return to its previous level. This time, it took half as long.
Read 5 tweets
27 Jul
The pandemic changed nearly every aspect of our lives -- work, play, parenting, even sleep. But it didn't affect everyone the same way.
@ellawinthrop & I dove deep into the American Time Use Survey to see the effects of Covid, and how we adapted to it.
nytimes.com/interactive/20…
Note: The pandemic also disrupted data collection itself, so all these charts are for May 10 - Dec. 31, after the most intense periods of lockdown. So think of it as a glimpse of how we lived life as the pandemic dragged on.
We spent a lot less time with people outside our own households in 2020 and a lot more time alone. Seniors spent the most time alone (8+ waking hours), but it was young ppl who experienced the biggest change. Teens (15-19) went from spending 4.5 hours alone in 2019 to 6 in 2020.
Read 15 tweets
2 Jul
Time for a #jobsday charts thread! Starting off a bit differently this month: Wages.
Avg. earnings up 10 cents/hour in June, and 43 cents over the past three months.
On one hand: Growth slowing. OTOH: Earnings now well above pre-pandemic trajectory.
We're seeing serious wage pressure in leisure and hospitality, consistent with anecdotal reports. Avg. earnings for nonsupervisors up 37 cents/hour in June, and more than $1.50 over past year.
Despite drop early in pandemic, their wages are now also above pre-crisis trend.
Notably, though, average weekly hours fell, both overall and for leisure and hospitality. That's surprising in an environment where employers can't find enough workers.
Read 14 tweets
2 Jul
U.S. employers added 850k jobs in June. Unemployment rate nudged up to 5.9%.
Full coverage:
nytimes.com/2021/07/02/bus…
Household survey is less strong. Participation flat, employment actually ever so slightly negative.
Another big gain in leisure and hospitality. Also in government (mostly local education -- have to look for possible seasonal adjustment issues there).
Read 4 tweets
30 Jun
Recent initial claims overstate the actual number of individuals entering the regular UI system in California by *two-thirds* per latest @CAPolicyLab:
capolicylab.org/publications/j… Image
Note that this is not about fraud, and it's not about people getting denied payments. It is (primarily) about people filing "additional claims," either when they re-enter UI after a period of work or after their benefits "chain" gets broken (after a payment delay, for example).
Meanwhile, more than 90% of new claims by individuals in CA were for people entering their second (or greater) spell of unemployment during the crisis. Shows the churn of people into and out of jobs during the pandemic.
(I wrote about this in March:
nytimes.com/2021/03/18/bus…) Image
Read 6 tweets

Did Thread Reader help you today?

Support us! We are indie developers!


This site is made by just two indie developers on a laptop doing marketing, support and development! Read more about the story.

Become a Premium Member ($3/month or $30/year) and get exclusive features!

Become Premium

Too expensive? Make a small donation by buying us coffee ($5) or help with server cost ($10)

Donate via Paypal Become our Patreon

Thank you for your support!

Follow Us on Twitter!

:(