The pandemic changed nearly every aspect of our lives -- work, play, parenting, even sleep. But it didn't affect everyone the same way.
@ellawinthrop & I dove deep into the American Time Use Survey to see the effects of Covid, and how we adapted to it.
nytimes.com/interactive/20…
Note: The pandemic also disrupted data collection itself, so all these charts are for May 10 - Dec. 31, after the most intense periods of lockdown. So think of it as a glimpse of how we lived life as the pandemic dragged on.
We spent a lot less time with people outside our own households in 2020 and a lot more time alone. Seniors spent the most time alone (8+ waking hours), but it was young ppl who experienced the biggest change. Teens (15-19) went from spending 4.5 hours alone in 2019 to 6 in 2020.
What did we do with the extra time? More screen time, more phone/video calls, more cooking. Some interesting tidbits in the breakdowns here: Young people (unlike everyone else) spent *more* time grooming last year, but less time exercising.
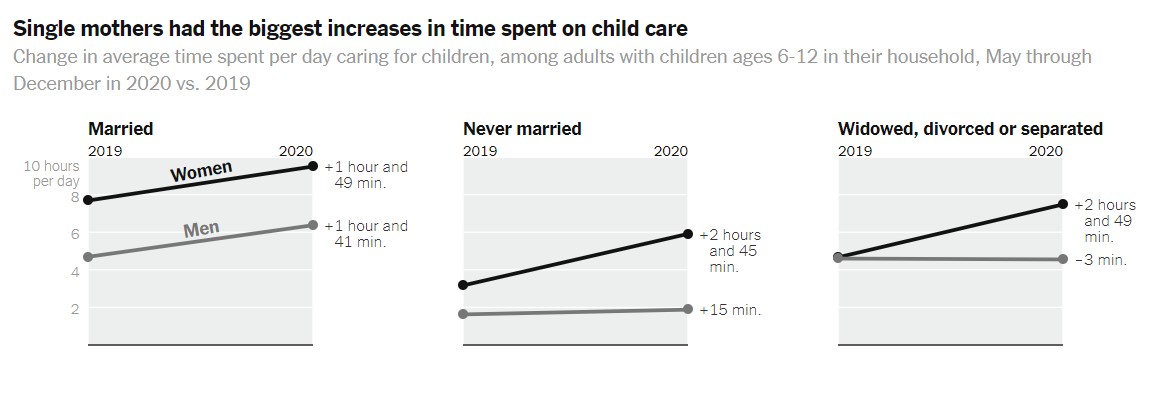
You've heard (or experienced!) a lot about parenting in the pandemic, but the time-use numbers are still revealing. Mothers of school-age children (6-12) spent *8 hours a day* taking care of kids in 2020, two hours more than in 2019. (Dads spent about 5.5 hours.)
(Note that these parenting charts include both "primary" and "secondary" childcare -- i.e. time spent directly caring for children and time watching the kids while doing other things. The latter experienced by far the bigger increase.)
More time with the kids meant more time cooking while parenting, more time cleaning while parenting, and especially more time working while parenting. Mothers of school-age children spent 48 more minutes on average working while parenting in 2020.
Note that's an average for ALL women with kids ages 6-12, including those who didn't work at all. If you look only at women who worked, they spent close to two more hours a day parenting-while-working than in 2019. (Dads spent an extra 45 minutes.)
In married households, men and women shouldered the extra childcare burden fairly equally (although moms still did much more overall). But single moms took on a ton of extra childcare work -- nearly three more hours a day.
Note: I didn't distinguish here between same-sex and opposite-sex couples. BLS, which oversees the survey, codes everyone as "male" or "female," so we don't have data on people identifying in other ways.
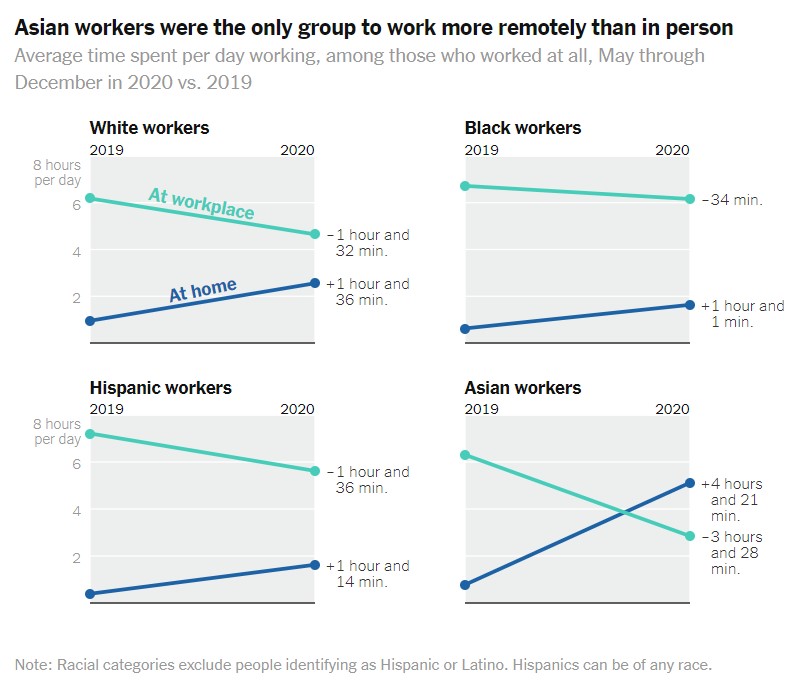
Americans on average worked less in 2020, but that's because fewer people were working. Among those who did work, total hours per day changed little. But *where* those hours were worked changed a lot.
Looking at the data month by month, a slim majority of working hours were done from home in May. (Recall that we don't have March/April data.) But after that, most people were back at their workplaces.
Work is where we see some of the starkest racial and socioeconomic divides. Hispanic and Latino workers were more likely to lose jobs; Black workers were more likely to have to keep working in person. White and Asian workers were much more likely to be able to work from home.
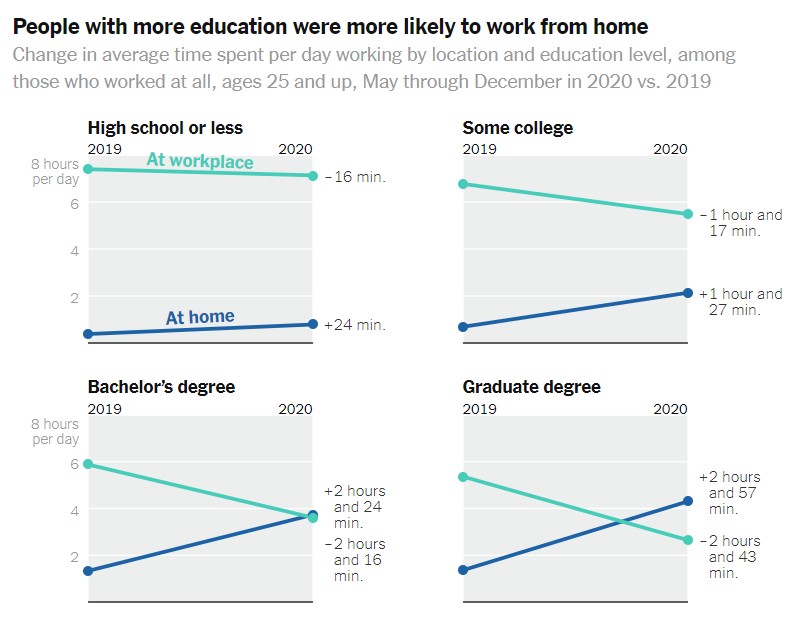
If you have a graduate degree, chances are you were working from home last year (or still are now). If you have a high school diploma or less, you probably had to keep going in person all year, if you kept your job at all.
More tidbits in our story, so have a look. And there is TONS more to explore in this data, so if you've got ideas, send 'em my way. Thanks to @ellawinthrop for the amazing graphics.
nytimes.com/interactive/20…

• • •

Missing some Tweet in this thread? You can try to force a refresh
 

Keep Current with Ben Casselman

Ben Casselman Profile picture

Stay in touch and get notified when new unrolls are available from this author!

Read all threads

This Thread may be Removed Anytime!

PDF

Twitter may remove this content at anytime! Save it as PDF for later use!

Try unrolling a thread yourself!

how to unroll video
  1. Follow @ThreadReaderApp to mention us!

  2. From a Twitter thread mention us with a keyword "unroll"
@threadreaderapp unroll

Practice here first or read more on our help page!

More from @bencasselman

2 Jul
Time for a #jobsday charts thread! Starting off a bit differently this month: Wages.
Avg. earnings up 10 cents/hour in June, and 43 cents over the past three months.
On one hand: Growth slowing. OTOH: Earnings now well above pre-pandemic trajectory.
We're seeing serious wage pressure in leisure and hospitality, consistent with anecdotal reports. Avg. earnings for nonsupervisors up 37 cents/hour in June, and more than $1.50 over past year.
Despite drop early in pandemic, their wages are now also above pre-crisis trend.
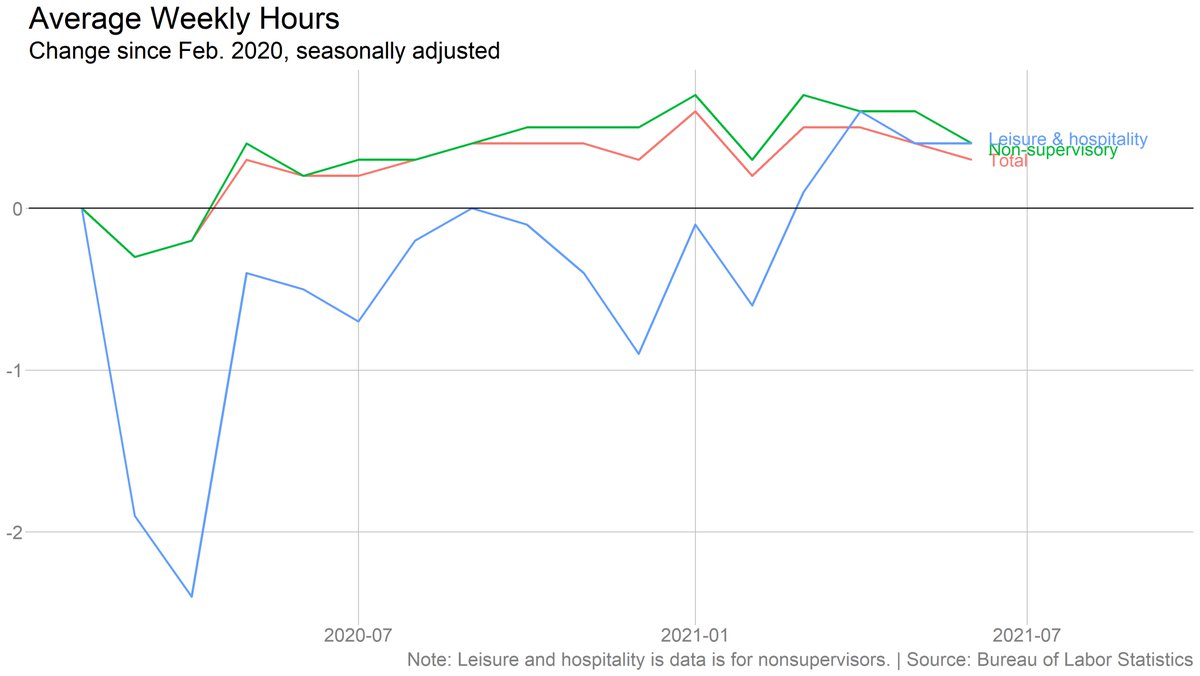
Notably, though, average weekly hours fell, both overall and for leisure and hospitality. That's surprising in an environment where employers can't find enough workers.
Read 14 tweets
2 Jul
U.S. employers added 850k jobs in June. Unemployment rate nudged up to 5.9%.
Full coverage:
nytimes.com/2021/07/02/bus…
Household survey is less strong. Participation flat, employment actually ever so slightly negative.
Another big gain in leisure and hospitality. Also in government (mostly local education -- have to look for possible seasonal adjustment issues there).
Read 4 tweets
30 Jun
Recent initial claims overstate the actual number of individuals entering the regular UI system in California by *two-thirds* per latest @CAPolicyLab:
capolicylab.org/publications/j… Image
Note that this is not about fraud, and it's not about people getting denied payments. It is (primarily) about people filing "additional claims," either when they re-enter UI after a period of work or after their benefits "chain" gets broken (after a payment delay, for example).
Meanwhile, more than 90% of new claims by individuals in CA were for people entering their second (or greater) spell of unemployment during the crisis. Shows the churn of people into and out of jobs during the pandemic.
(I wrote about this in March:
nytimes.com/2021/03/18/bus…) Image
Read 6 tweets
25 Jun
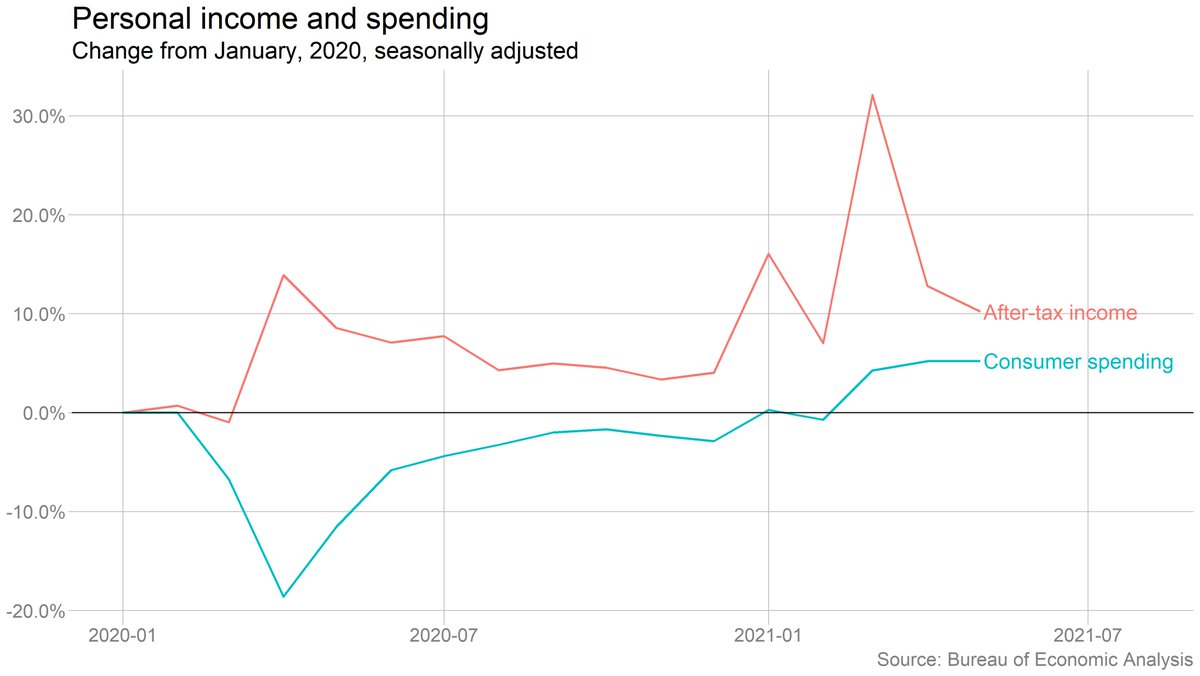
Personal income fell 2% in May. Spending flat. But both above prepandemic levels.
The drop in income was driven by a decline in government transfers (mostly the end of the direct checks under the American Rescue Plan). Wage and salary income rose, though more slowly than in April.
Spending on goods fell and spending on services rose, but we still haven't seen anything close to a wholesale reversal of the big pandemic shifts in spending. Have to see what happens this summer.
Read 10 tweets
4 Jun
Job growth picked up in May, but was still weaker than in March. Big-picture, we're still down 7.6 million jobs from before the pandemic.
Remote work continuing to fall as more offices reopen. 16.6% of workers were remote in May, down from peak of 35.4%. 30% of professional workers, down from 57.4%.
The number of workers reporting that they are on temporary layoff fell below 2 million for the first time since the pandemic began. Permanent layoffs also falling, but more slowly.
Read 13 tweets
4 Jun
U.S. employers added 559,000 jobs in May. The unemployment rate fell to 5.8%.
nytimes.com/2021/06/04/bus…
Very small upward revisions to March and Aril. Net gain of 27,000 jobs vs previous estimates.
Unemployment rate fell for "good" reasons in that employment was up, unemployment was down. But labor force was basically flat (actually down slightly), which will add fuel to "labor shortage" concerns.
Read 5 tweets

Did Thread Reader help you today?

Support us! We are indie developers!


This site is made by just two indie developers on a laptop doing marketing, support and development! Read more about the story.

Become a Premium Member ($3/month or $30/year) and get exclusive features!

Become Premium

Too expensive? Make a small donation by buying us coffee ($5) or help with server cost ($10)

Donate via Paypal Become our Patreon

Thank you for your support!

Follow Us on Twitter!

:(