1/ our paper elucidates the end ejection tissue velocity spike as well, and relation to AVC.
onlinelibrary.wiley.com/doi/epdf/10.11…
onlinelibrary.wiley.com/doi/epdf/10.11…
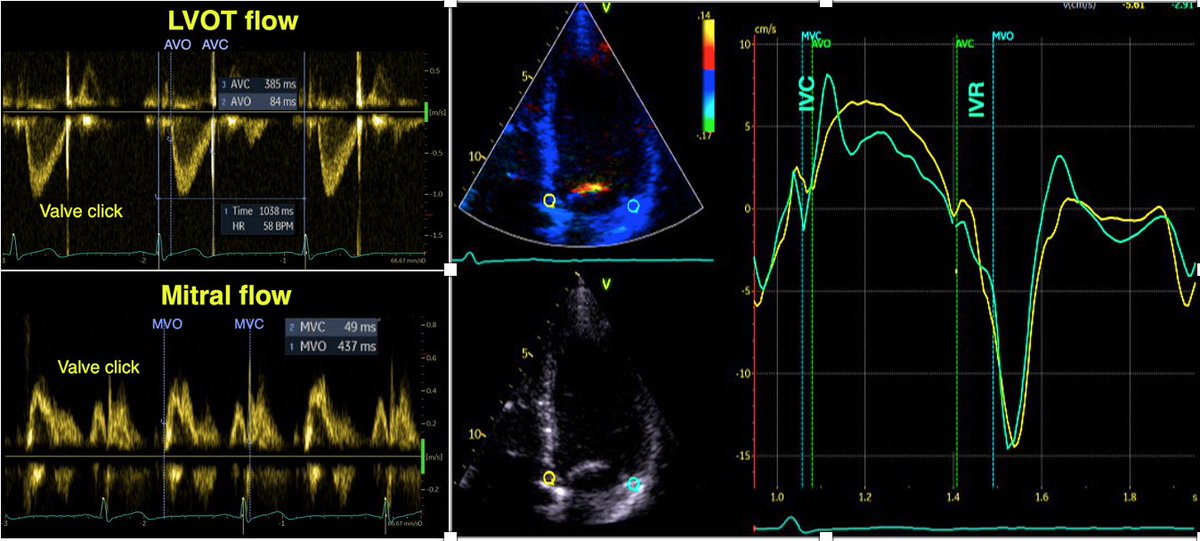
The negative velocity post ejection spike had an average duration of 35 ms, ending about 10 ms after AVC in the septum. Thus, this spike is not isovolumic relaxation, and the true IVR (AVC to MVO) is from the end of the spike to start of mitral flow.

The close relation between AVC and the end of the pre ejection spike has been shown before by phonocardiography pubmed.ncbi.nlm.nih.gov/16364793/ , and by high frame rate B-mode of the aortic valve pubmed.ncbi.nlm.nih.gov/20331696/ .
In the lateral wall, neither by velocity, strain rate, strain nor annular displacement, the post ejection lengthening was not so prevalent, and relation to AVC not so clear. This is important for correct measuring of IVRT by using TDI, it can only be done in the septum

5/ Relaxation is tension devolution, starting at peak LV pressure; last part of ejection being driven by pressure and inertial flow. At end of flow, there is no shortening, but continuing relaxation results in wall elongation, the post ejection velocity /displacement.
6/ This motion will be asymmetric, the open aortic valve offer less resistance than the closed mitral valve. The motion of the aortic root in a stationary blood column will in itself be a mechanism for closing the valve.
7/ the presence of vortices in the sinus valsalvae, will assist in separating the cusps from the aortic wall, reducing the energy necessary for AVC pubmed.ncbi.nlm.nih.gov/5635642/
8/ Also, this motion will cause the aortic annulus to move along, “capturing” a small volume that increases the LV volume, as has been shown experimentally. pubmed.ncbi.nlm.nih.gov/18606917
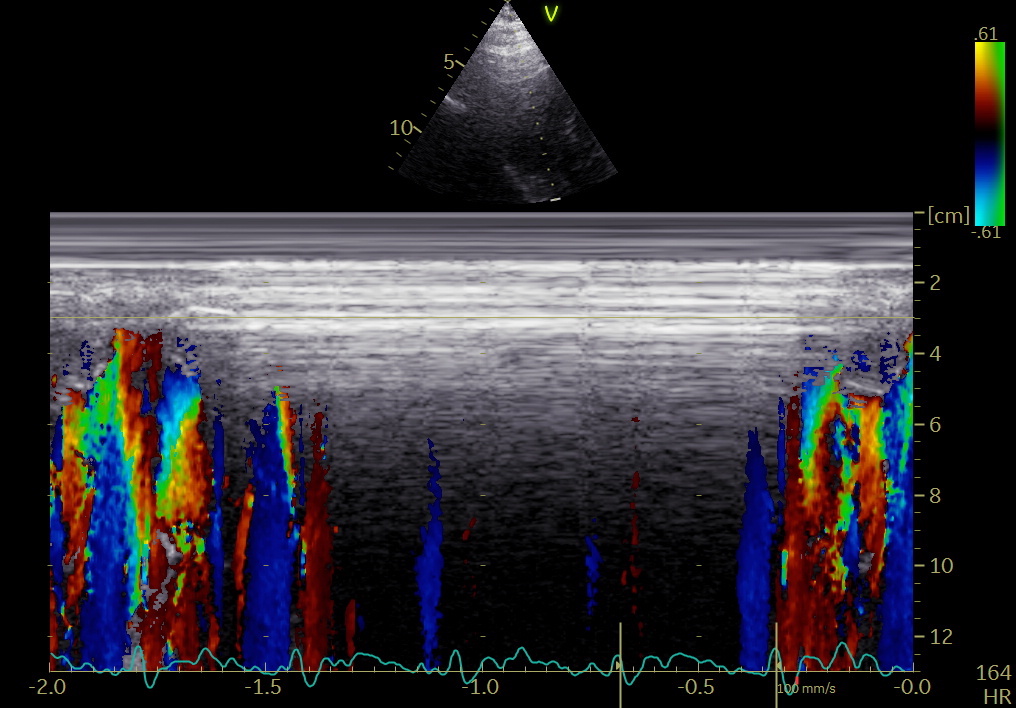
And the time course of AVC is concomitant with the post ejection lengthening (velocity spike), as shown in the paper and illustrated here in a skewed M-mode
through septum, aortic valve and posterior aortic annular rim.
through septum, aortic valve and posterior aortic annular rim.

10/ Lengthening before AVC also will give a more rapid AO pressure drop as shown by Wiggers (1921 Studies on the consecutive phases of the cardiac
cycle. American Journal of Physiology-Legacy
Content, 56, 415–438), termed by him "protodiastole", which thus is duration of AVC.
cycle. American Journal of Physiology-Legacy
Content, 56, 415–438), termed by him "protodiastole", which thus is duration of AVC.
11/ The final closure of AV, will give an abrupt increase in resistance, stopping the post ejection motion: end of spike in vel/SR and notch in displacement/strain:


unroll
@threadreaderapp
@threadreaderapp
• • •
Missing some Tweet in this thread? You can try to
force a refresh