Apart from the physiological implications, what are the consequences of this study onlinelibrary.wiley.com/doi/epdf/10.11… for timing of valve openings and closures by tissue Doppler?
1/ Valve closures can be timed by tissue Doppler and mitral ring motion. However, only the septal motion will reliably show AVC.
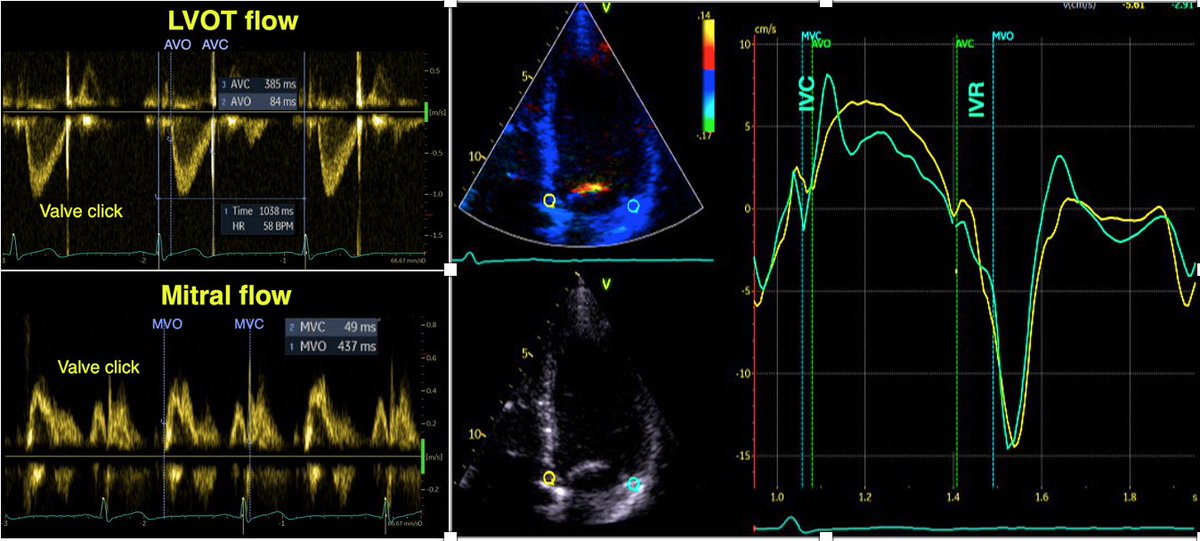
2/ MVO is close to the END of the pre ejection spike. Timing MVC by the start of the pre ejection spike will result in an error of about 40 ms too early. Timing by the peak R wave will result in about the same error.
3/ AVC is closest to the END of the post ejection spike. Timing by the start of the spike will result in about 25 ms too early.
4/ In colour TDI of the mitral ring, pre ejection spike is red (positive), end of this is red-to-blue transition. Post ejection spike is blue (negative), end of this is blue-to-red transition. Again the septum is the most reliable.
5/ As colour transition marks the velocity zero crossing points, they differ a little from the nadir/peaks of the curves. In fact the zero crossing points are the most accurate in determining the valve closures.
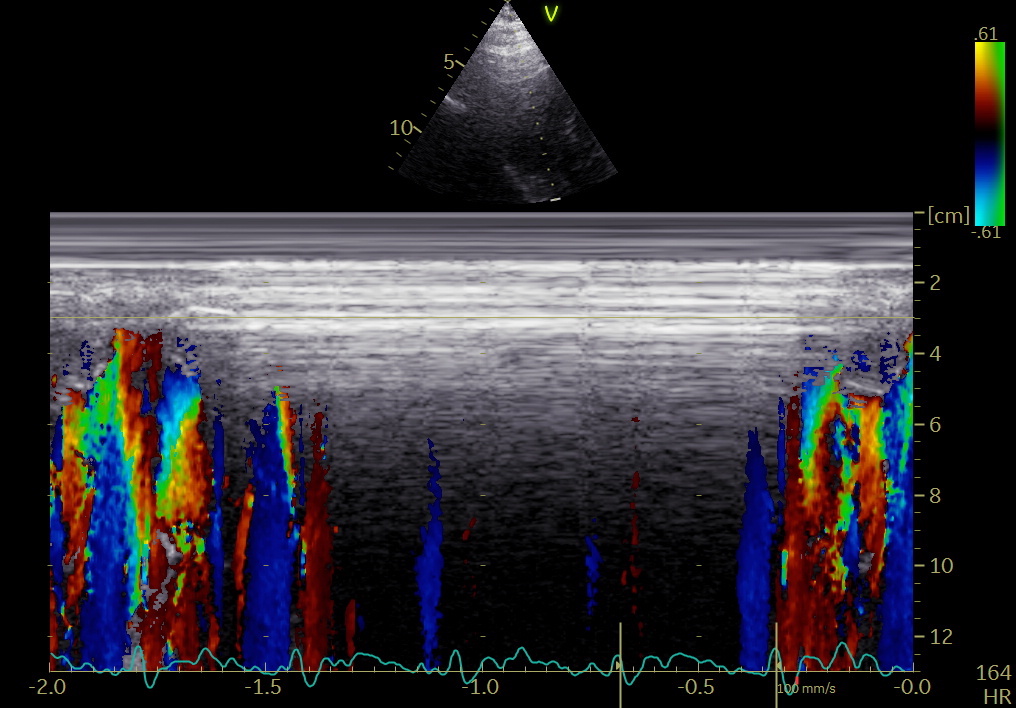
6/ What about the colour M-mode of the anterior mitral leaflet? The mitral leaflet moves together with the mitral ring when MV is closed, but independently during filling.
7/ This means that the pre ejection spike is invisible, being masked by the rapid downward motion of the mitral leaflet, but MVC is excellently visible by the blue-to-red transition of the end of this downward motion.
8/ The short red-to-blue-to-red transition making transition from IVC to ejection, was only visible in about half of the cases, as opposed to all in the septal mitral ring.
8/ the short red-to-blue-to-red transition, marking IVC and the onset of ejection, was limited to about half the cases, both in the mitral ring and leaflet.
9/ The negative post ejection was visible by CAMM in the septal ring in all subjects, but only in half by the mitral leaflet. If present, AVC was the END of this (blue to red transition), cfr. curves, not by the start as maintained previously, the error is about 25 ms.
In this last image, the timing of AVC is evident also from the phonocardiogram, as documented already in 2006 pubmed.ncbi.nlm.nih.gov/16364793/

• • •

Missing some Tweet in this thread? You can try to force a refresh
 

Keep Current with Asbjørn Støylen

Asbjørn Støylen Profile picture

Stay in touch and get notified when new unrolls are available from this author!

Read all threads

This Thread may be Removed Anytime!

PDF

Twitter may remove this content at anytime! Save it as PDF for later use!

Try unrolling a thread yourself!

how to unroll video
  1. Follow @ThreadReaderApp to mention us!

  2. From a Twitter thread mention us with a keyword "unroll"
@threadreaderapp unroll

Practice here first or read more on our help page!

More from @strain_rate

26 Aug
1/ our paper elucidates the end ejection tissue velocity spike as well, and relation to AVC.
onlinelibrary.wiley.com/doi/epdf/10.11…
The negative velocity post ejection spike had an average duration of 35 ms, ending about 10 ms after AVC in the septum. Thus, this spike is not isovolumic relaxation, and the true IVR (AVC to MVO) is from the end of the spike to start of mitral flow.
The close relation between AVC and the end of the pre ejection spike has been shown before by phonocardiography pubmed.ncbi.nlm.nih.gov/16364793/ , and by high frame rate B-mode of the aortic valve pubmed.ncbi.nlm.nih.gov/20331696/ .
Read 12 tweets
20 Jul
1/ Our paper on pre- and post ejection tissue velocities by #EchoFirst in relation to valve closures and openings is out: onlinelibrary.wiley.com/doi/epdf/10.11…
2/ 22 healthy subjects, Valve openings and closures timed by Doppler flow, and transewfrred to Tissue Doppler recordings. Image
3/ Pre ejection velocities started 24.8 ms after start QRS, with a duration of 51.5 ms, ending about 11.5 ms after MVC. Thus, both electromechanical delay and pre ejection velocity occurs *before* onset of IVC, and are not a measure of IVC or Isovolumic acceleration. Image
Read 12 tweets
19 Mar
1/ Man ca 30, exertional dyspnea, CPET with normal VO2max, but pulmonologist concerned about possible drop in CO at peak exercise. Normal resting echo, no LVOT obstruction or gradient, no MR. Dobutamine stress: Chordal SAM, no regional ischemia
2/ Intraventricular gradient
3/ shown by CMM to be mid ventricular, moving towards apex in systole. No concomitant MR.
What next?
Read 7 tweets
27 Jan
1/ #LBBB generates often a classical pattern on #EchoFirst. The pattern is very distinctive in Tissue Doppler of the septum.
The classical pattern arises from the time lapse of the activation and relaxation of the two walls, creating a pattern of interaction due to a sequence temporal imbalances of the tension between the two walls.
2/ As the septum is activated first, it contracts (shortening - septal flash) without activation of the lateral wall, which stretches. This generates slower pressure build up than a normal IVC, which then is prolonged.
Read 10 tweets
7 Oct 20
1/ It's a pity that the publication perpetuate the error that myocardial work is load independent. imaging.onlinejacc.org/content/13/7/1…
It's the ratio of SV and BP that's closest to afterload dependence. MW being the *product* of SV (and hence also preload dependent) is very afterload dependent (although an inverted U relation can be hypothetisized.
3/ Thus, if SV ⬇️, MW⬇️, but if LVEDV also ⬇️, EF will ➡️. Sp far so good. But if BP ⬆️, MW⬆️, even if SV and GLS ⬇️ and EF➡️, as shown in pubmed.ncbi.nlm.nih.gov/32966690/, meaning that the demand increased while performance (SV) decreased, both due to increased afterload.
Read 6 tweets
3 Oct 20
1/ Thread on myocardial work. What does it actually mean, and is it really useful? It is a spin-off from pressure-volume loops, which are an illustration to visualise the relation between stroke volume, pressure and contractility, and to assess physiology in animal experiments.
2/ The area of the PV-loop is LV ejection work. The height of the PV-loop is the SBP-LVDBP difference, the width is the SV. Mean SBP and mean LVDBP ((blue dotted rectangle), shows the relation in an easy way. GMW is SV x (mean SBP - mean LVDBP).
3/ This, of course means that it is definitely preload dependent, as increased preload increases SV. Increased afterload, on the other hand increases pressure work, but as afterload decreases SV, the relation is somewhat more uncertain.
Read 18 tweets

Did Thread Reader help you today?

Support us! We are indie developers!


This site is made by just two indie developers on a laptop doing marketing, support and development! Read more about the story.

Become a Premium Member ($3/month or $30/year) and get exclusive features!

Become Premium

Too expensive? Make a small donation by buying us coffee ($5) or help with server cost ($10)

Donate via Paypal Become our Patreon

Thank you for your support!

Follow Us on Twitter!

:(