@stellensatz A thread on testing strategies. They can be classified in three broad types: 1) random testing, 2) targeted testing, and 3) infection chasing. Targeted testing is biased towards those more likely to be infected. For example, testing only symptomatic people.
Infection chasing is biased towards those less likely to be infected. For example, testing everyone in a locality if one positive case is found. This is the strategy recommended by WHO. So how does one find out which strategy is a state following?
The answer is already above: divide test positivity ratio (TPR) by the percentage of active cases. TPR will be close to percentage of active cases in case of random testing, significantly above in case of targeted testing, and significantly below in case of infection chasing.
There is one problem though: how does one find out percentage of active cases at any time? We only know detected active cases which can be much smaller than actual active cases. Also, to compute percentage, what should be denominator? Total population of the region?
What if pandemic is active only over a small section of population? Testing will be mostly limited to this section, and so to correctly compute the percentage of active cases, one needs to divide by population of the section.
SUTRA model provides a way: it shows that total number of active cases is T/epsilon where T is the reported active case, and population of section where pandemic is active equals rho * P where P is total population (rho, epsilon are parameters of model).
So fraction of active cases equals T/(epsilon*rho*P). The model also provides a robust way of estimating value of epsilon*rho at any time. Computing their values individually requires a calibration which is not always available but product can be computed without calibration.
Define normalized TPR (NTPR) as ratio of TPR and percentage of active cases, ie, 100*T/(epsilon*rho*P). Let us see how NTPR has changed for a few states. I start with Kerala. The plot has percentage of active cases on y-axis, date on x-axis, and size of bubbles denote NTPR.
It is evident that Kerala followed Infection chasing strategy up to August last year. It was quite a success, and was highlighted in the media. From October onward, the strategy started shifting, moving fully to Targeted testing by March this year.
This explains why Kerala is unable to control the spread now. In Targeted testing, the TPR is much higher in relation to percentage of active infections which means one is detecting cases primarily from "core" of pandemic and not hitting its "boundary."
Let us look at Maharashtra. They have consistently followed Targeted testing strategy. The huge bubbles in July last year and March this year indicate concentration of testing to only symptomatic.
The third state we look at is UP. It has been consistently doing Infection chasing! This corroborates aggressive village-by-village testing done in the state.
However, there appears an anomaly here: Infection chasing would typically detect large fraction of cases thus making epsilon large. However, for UP, epsilon is around 1/100. It implies that only 1 in 100 positive cases are detected! How does one explain this?
A plausible reason is that a very large fraction of clusters of cases were fully asymptomatic, and hence escaped detection. Entire cluster being asymptomatic is crucial since even one detected case in a cluster would trigger extensive testing.
If this argument is correct, the next question is why have there been so many more asymptomatic cases in UP than some other states? This needs a proper study. There appears to be heterogeneity within India when it comes to Covid. I will post more states when they get done.

• • •

Missing some Tweet in this thread? You can try to force a refresh
 

Keep Current with Manindra Agrawal

Manindra Agrawal Profile picture

Stay in touch and get notified when new unrolls are available from this author!

Read all threads

This Thread may be Removed Anytime!

PDF

Twitter may remove this content at anytime! Save it as PDF for later use!

Try unrolling a thread yourself!

how to unroll video
  1. Follow @ThreadReaderApp to mention us!

  2. From a Twitter thread mention us with a keyword "unroll"
@threadreaderapp unroll

Practice here first or read more on our help page!

More from @agrawalmanindra

11 Jul
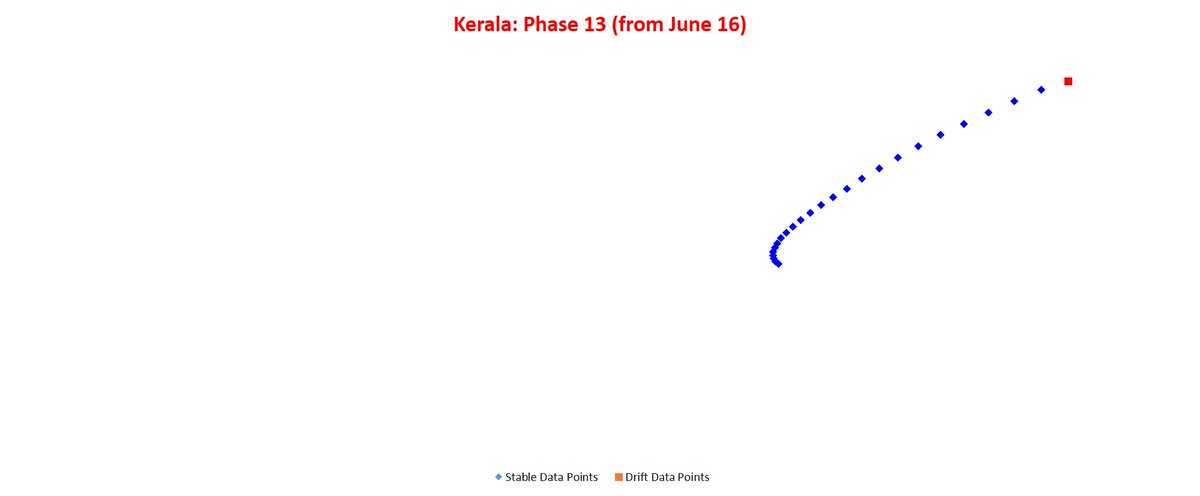
@stellensatz Starting a new thread on states where infections are not coming down as expected, leading to apprehensions about a third wave. Let us see Kerala first. As one can see, the numbers were coming down nicely until mid-June, but then plateaued and now are rising. Image
Current phase plot for Kerala shows continuous drifting. The points are turning, which indicates that stability is still far off. What is causing this? Parameter estimates, admittedly imprecise due to drift, show that contact rate is not high, but reach has increased by 25%. Image
It could be due to either pandemic expanding to newer regions, or a new mutant that is bypassing existing immunity to a significant extent. Genome sequencing done in Kerala has not thrown any such new mutant so far. So it is likely to be former, which is good news!
Read 27 tweets
2 Jul
<SUTRA's analysis of third wave> @stellensatz @Ashutos61 @Sandeep_1966 @shekhar_mande It took us a while to do the analysis for three reasons. First, loss of immunity in recovered population. Second, vaccination induced immunity. Each of these two need to be estimated for future.
And third, how to incorporate the two in the model. Fortunately, it turned out that both can be incorporated by suitably changing contact rate and reach parameters. So that takes care of third one. First two required detailed analysis.
We went through the studies done in the past on loss of immunity and used conservative numbers for them. Similarly, we looked at the projected vaccination rate over next few months, included the effects of vaccine-hesitancy, and arrived at month-wise estimates for vaccination.
Read 9 tweets
17 May
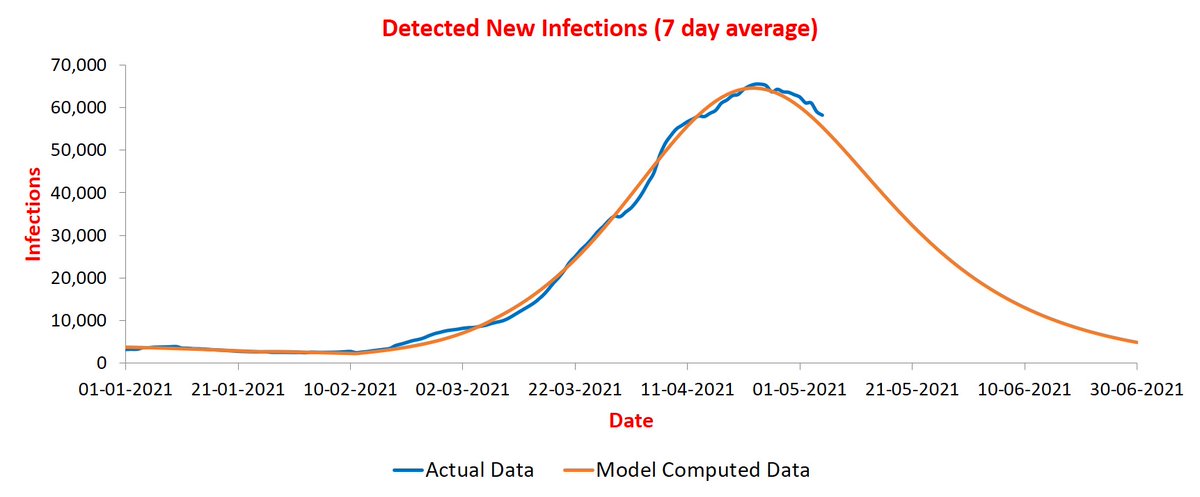
Starting a new thread on analysis of lockdown in various states. First, let us examine UP. The plot for UP and SUTRA projections for it from 1st March are below.
UP went through two phase changes in this period. First started on 15th March with 10 days of drift. In this phase, the contact rate went up to 0.53 (95% CI: +- 0.03) from 0.4. And reach roughly doubled. This double whammy caused sharp rise in infections as is evident.
Next phase change started on 21st April with 12 days of drift. In this phase, contact rate went down to 0.28 (95% CI: +- 0.01) and reach further increased by more than 50%.
Read 13 tweets
6 May
<Update on 6/5> @stellensatz I am finding it increasingly difficult to post updates. Hence, getting a website prepared that will do the job. Hope it will be ready by tomorrow. That will allow me to focus more on discussions.
Many posters have pointed out erroneous predictions done for second wave in early April. I already explained the reasons in India thread. If they do not sound convincing, please pay no attention to our predictions. I am sure there are better things to do!😊
For those, who find some value in our predictions, here are updates. Maharashtra continues its downward journey. Notice that orange curve is fitting better now! It is because I updated the simulation with data up to 5th May. Earlier one was with data up to 24th April.
Read 22 tweets
1 May
@thattai I am glad to see decent language now unlike your earlier posts. I hope you can make this a habit. Your argument, as I understand it, is not that the model went wrong in March, rather that policy makers were misled by it. If yes, your argument is based on flawed premise.
Policy makers do not make decisions based on one input. They collect them from multiple sources. While we did give our feedback to them last month, and it was received graciously, they were skeptical about our predictions. Seemingly they had better inputs. 😊
As for our model, it adopts a very different approach to parameter estimation. An approach that is becoming ubiquitous: use data. If one argues that it needs to be improved, I will readily agree. However, to retire? That is truly bizarre!
Read 6 tweets
23 Apr
I have been asked by many people about details of the SUTRA model. We have a preprint uploaded at arxiv.org/abs/2101.09158. It describes how we compute parameter values and phase changes.
India projections can be found in this thread:
Read 4 tweets

Did Thread Reader help you today?

Support us! We are indie developers!


This site is made by just two indie developers on a laptop doing marketing, support and development! Read more about the story.

Become a Premium Member ($3/month or $30/year) and get exclusive features!

Become Premium

Too expensive? Make a small donation by buying us coffee ($5) or help with server cost ($10)

Donate via Paypal Become our Patreon

Thank you for your support!

Follow Us on Twitter!

:(