This blog post has received a lot of attention.
A thread.
🧵
A thread.
🧵
https://twitter.com/normanswan/status/1430870353065103362
In short, the blog post takes public misconceptions about the technical report from Doherty, makes a cursory read of the report, repeats misconceptions, accuses Doherty of intentional scientific misconduct to lead Australia to disaster.
Crackpot stuff.
2/🧵
Crackpot stuff.
2/🧵
Not really worth taking apart. But it’s been retweeted by a number of figures who should really know better. So let’s take a look.
Doherty Institute report is here if you want to read along.
3/🧵
doherty.edu.au/uploads/conten…
Doherty Institute report is here if you want to read along.
3/🧵
doherty.edu.au/uploads/conten…
The bulk of the blog post is based on a fundamental misunderstanding of the purpose of the section “Dynamics and consequences given timing of transition to Phase B”.
4/🧵
4/🧵
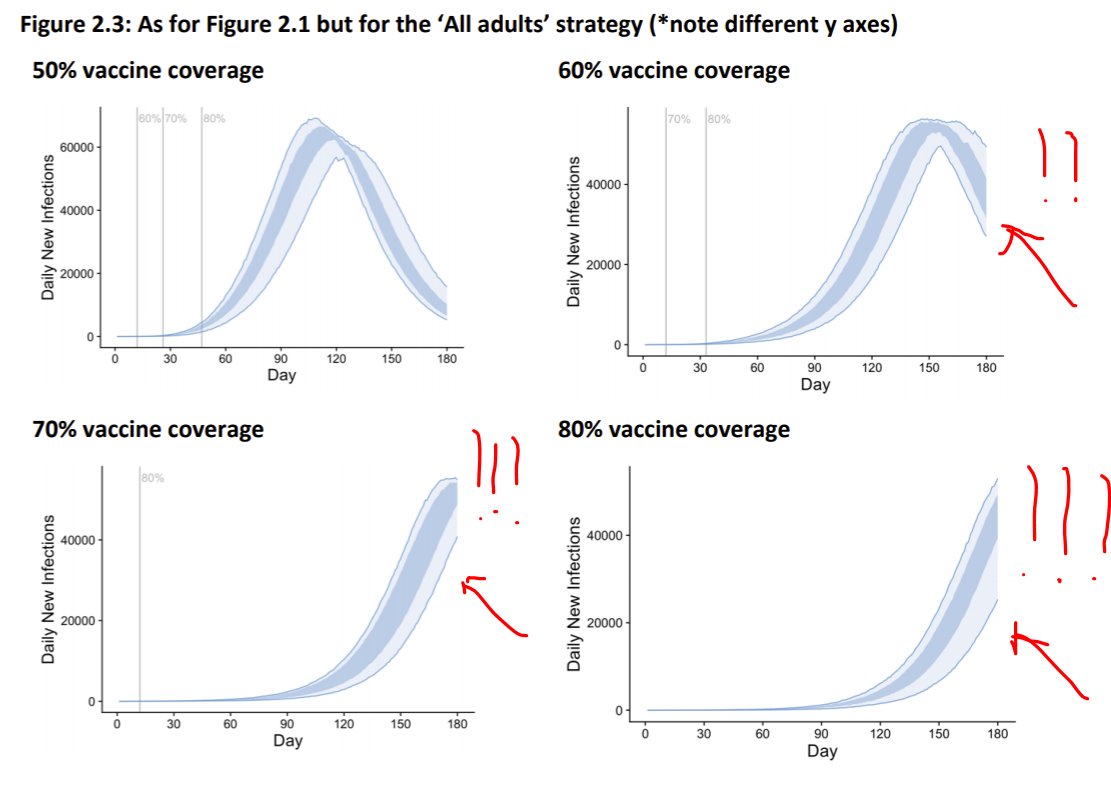
The complaint is that the models were only run for 180 days, so they give a misleading picture of the hospitalizations/deaths in each scenario.
Here's a relevant plot from the blog - looks scary, right? They cut off the bad stuff!
5/🧵
Here's a relevant plot from the blog - looks scary, right? They cut off the bad stuff!
5/🧵
This section models what will happen assuming online baseline public health safety measures were implemented, and partial effectiveness of testing/tracing/isolation/quarantine (TTIQ).
6/🧵
6/🧵
This is a “worst case” scenario. It asks, what happens if we open up and let the epidemic rip, and do nothing to stop it?
Why run this model at all? The answer is in the title: to understand the *dynamics*.
7/🧵
Why run this model at all? The answer is in the title: to understand the *dynamics*.
7/🧵
This is intended to answer: In the worst case scenario, how fast does the epidemic get away from us? If it is slow (e.g. takes 180 days) then we have a chance to react with PHSMs, further vaccinations, etc.
8/🧵
8/🧵
Why are dynamics important?
The Q is, if we know we’re going to reach 80% vax, why not open at 50%/60%/70%, since we’ll get to 80% quickly enough? The answer is that things might get out of control rapidly, overwhelming TTIQ, and then health care, before we get to high vax.
9/🧵
The Q is, if we know we’re going to reach 80% vax, why not open at 50%/60%/70%, since we’ll get to 80% quickly enough? The answer is that things might get out of control rapidly, overwhelming TTIQ, and then health care, before we get to high vax.
9/🧵
Why cut it off at 180 days?
Remember that the *assumptions* are no PHSMs and no more vax. Under those assumptions, the *only* thing that stops outbreak is add'l infection-acquired immunity. # of infections is solely determined by the # vaxxed, and that’s capped at 80%.
10/🧵
Remember that the *assumptions* are no PHSMs and no more vax. Under those assumptions, the *only* thing that stops outbreak is add'l infection-acquired immunity. # of infections is solely determined by the # vaxxed, and that’s capped at 80%.
10/🧵
So the long-term outcome is exactly the same in every simulation!
If you’re an epidemiologist, this is bleeding obvious, so you don’t need to state it.
But, if you’re an electrical engineer, it looks like a conspiracy.
11/🧵
If you’re an epidemiologist, this is bleeding obvious, so you don’t need to state it.
But, if you’re an electrical engineer, it looks like a conspiracy.
11/🧵
We can check that this is the case by scaling the plots and placing them on top of one another.
If you open completely at 80% you get the same outbreak as if you had opened at 70% and proceeded to 80% 22 days later, only delayed by 40 days.
12/🧵
If you open completely at 80% you get the same outbreak as if you had opened at 70% and proceeded to 80% 22 days later, only delayed by 40 days.
12/🧵


Anyway, here’s Doherty’s slide on the results. The box in upper right tells you that this is the worst case, and will be lower with PHSMs in place.
13/🧵
13/🧵

Next complaint is that Doherty is based on maintaining partially effective TTIQ. “Partial” is based on VIC’s experience at the peak of 2nd wave. To me, that's pretty ineffective. The post argues NSW is worse. Maybe, I don’t know. I’m not sure that makes Doherty misleading.
14/🧵
14/🧵
The next complaint is that Doherty starts their dynamics simulations at 30 total infections, whereas NSW has far more active cases. That’s a reasonable complaint.
But the simulations illustrate the *dynamics*, and already assume partially effect TTIQ.
15/🧵
But the simulations illustrate the *dynamics*, and already assume partially effect TTIQ.
15/🧵
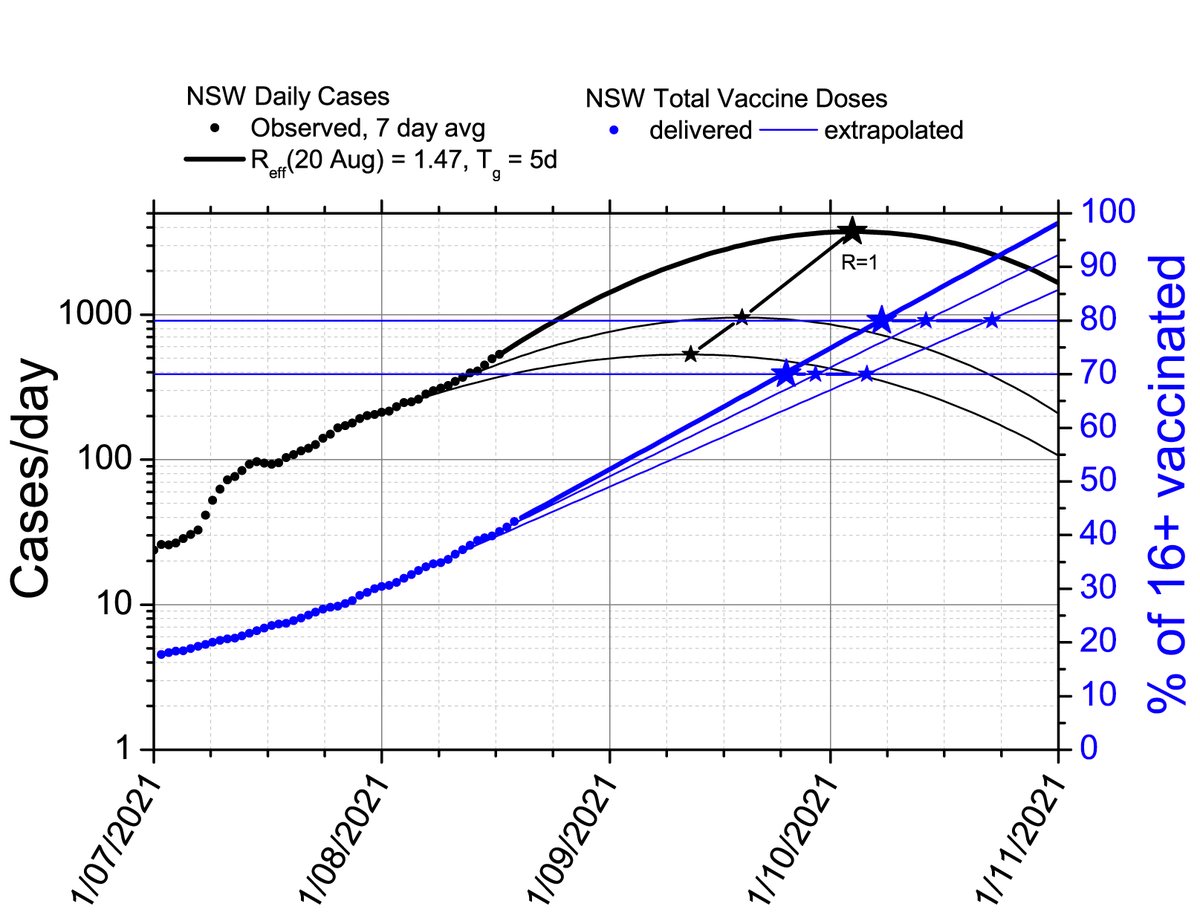
So it’s simple to just read off what would happen if you started at 1,000 infections/day – it just advances where you are on the curve.
16/🧵
16/🧵
If NSW hits 80% at 1,000 cases/day, they're here.
Obviously this is bad news if you’re NSW and you plan to get to 80% vaccination, end all PHSMs, and just stop vaccinating. But that’s not the plan anyway.
17/🧵
Obviously this is bad news if you’re NSW and you plan to get to 80% vaccination, end all PHSMs, and just stop vaccinating. But that’s not the plan anyway.
17/🧵

NSW will have little breathing room. So they'll need to relax restrictions slowly. But the rhetoric from NSW gov't indicates they understand this. It's important to hold NSW to it, but this doesn't make Doherty misleading.
18/🧵
18/🧵
The next part comes from a basic misunderstanding of why this plot from Doherty is on a log scale on the vertical.
Answer: the various measures to reduce R are multiplicative, which becomes additive on a log scale.
Simple as that.
19/🧵
Answer: the various measures to reduce R are multiplicative, which becomes additive on a log scale.
Simple as that.
19/🧵

In other words, if TTIQ reduces Reff by half, and 60% vax reduces Reff by half, then it goes from 8 to 4 and 4 to 2, whichever order you do them in.
Boxes of the same height on this plot have the same size effect (e.g. reduce by a factor of 2).
Not a conspiracy.
20/🧵
Boxes of the same height on this plot have the same size effect (e.g. reduce by a factor of 2).
Not a conspiracy.
20/🧵
Then there’s the usual cherry-picking of data…
Israel has rapid growth of cases with delta and high vax, therefore the transmission assumptions must be wrong!
But Denmark has delta, and zero growth of cases with high vax, modest PHSMs.
21/🧵
Israel has rapid growth of cases with delta and high vax, therefore the transmission assumptions must be wrong!
But Denmark has delta, and zero growth of cases with high vax, modest PHSMs.
21/🧵

Last, the conclusion suggests that there is an alternative, which is, I guess, suppress delta to zero with PHSMs.
First, this is entirely in line with Doherty; the plan is to use vaccination and mild to moderate PHSMs to suppress outbreaks, lockdown only if abs necessary.
22/🧵
First, this is entirely in line with Doherty; the plan is to use vaccination and mild to moderate PHSMs to suppress outbreaks, lockdown only if abs necessary.
22/🧵
But the counterexample given is that Taiwan suppressed their delta outbreak with PHSMs alone, so maybe we should just do that.
But, this is incorrect, Taiwan's outbreak was alpha. No country has suppressed a delta outbreak the size of NSW's with PHSMs alone.
23/🧵
But, this is incorrect, Taiwan's outbreak was alpha. No country has suppressed a delta outbreak the size of NSW's with PHSMs alone.
23/🧵
Long thread. Bottom line: it's a technical report. And it's technically correct. The data aren't presented in a way that is *intentionally* misleading. They might be presented in a way that they might mislead a non-epidemiologist, but that is not the intended audience.
24/24🧵
24/24🧵
• • •
Missing some Tweet in this thread? You can try to
force a refresh