Here is a long/technical thread on my attempt to reverse-engineer the assumptions from the Doherty Institute report to the National Cabinet (linked) regarding delta severity, PHSM effectiveness, and vaccine effectiveness to match observations.
1/🧵
doherty.edu.au/uploads/conten…
1/🧵
doherty.edu.au/uploads/conten…
Here are the figures from the Doherty Institute report. Note that there are a couple versions of these figures in the report; these assume the “all adults” strategy for vaccination.
2/🧵
2/🧵


The figures attempt to show graphically the effect of various interventions on the transmission potential (TP). TP is in essence R_eff, but calculated on the population level, as I understand it. When TP>1, cases grow, and TP<1, cases decline.
3/🧵
3/🧵
The vertical axis on each figure is a logarithmic scale. This is because each intervention has a multiplicative effect on TP, and multiplication becomes addition on a log scale.
4/🧵
4/🧵
https://twitter.com/MichaelSFuhrer/status/1431456736787898378
This means boxes of the same size have the same size multiplicative effect on TP, and it doesn’t matter which order you put them in.
5/🧵
5/🧵
First, I did some measurements of the sizes of the boxes on the graphs to find the multiplicative factors:
Baseline PHSM + partial TTIQ = 0.454
Baseline PHSM + optimal TTIQ = 0.368
Low PHSM = 0.752
Medium PHSM = 0.807
High PHSM = 0.728
6/🧵
Baseline PHSM + partial TTIQ = 0.454
Baseline PHSM + optimal TTIQ = 0.368
Low PHSM = 0.752
Medium PHSM = 0.807
High PHSM = 0.728
6/🧵
(Note: High PHSM includes the effects of medium and low PHSM, and medium PHSM includes the effects of low PHSM, that’s why they stack on top of one another.)
7/🧵
7/🧵
PHSM’s are public health and social measures, with:
Baseline = NSW March 2021 (no stay-at-home, social dist)
Low = NSW 23 Aug 2020 (no stay-at-home, caps on venues)
Medium = NSW 1 July 2021 (think “Stage 3 lockdown”)
High = VIC 23 Aug 2020 (think “Stage 4 lockdown”)
8/🧵
Baseline = NSW March 2021 (no stay-at-home, social dist)
Low = NSW 23 Aug 2020 (no stay-at-home, caps on venues)
Medium = NSW 1 July 2021 (think “Stage 3 lockdown”)
High = VIC 23 Aug 2020 (think “Stage 4 lockdown”)
8/🧵
Size of the blue boxes comes from Doherty modelling of the effect of vaccination on TP. This is rather complex, and takes into account distribution strategies for vax by age, and also a transmission matrix (likelihood of transmission among/between different age groups).
9/🧵
9/🧵
Suffice it to say, it isn’t easy for the layperson to reproduce the size of the blue boxes for an arbitrary vaccination rate.
I can say a couple things however.
11/🧵
I can say a couple things however.
11/🧵
1) Doherty’s model estimates a somewhat larger effect of vaccination than you would get if you assume random transmission between age groups. For example, at 80% vaccination, the multiplicative factor is 0.358.
12/🧵
12/🧵
Now, 80% vax only vaxxes 64% of the total population, so you’d need slightly more than 100% vax effectiveness to get a factor of 0.358. The reason vax is so effective in the Doherty Institute model is that working-age adults dominate transmission.
13/🧵
13/🧵
2) The effect of vaccination depends a fair amount on the strategy for allocation among age groups, for the same reason.
3) Vaccinating children counts for very little within this model. Is that reasonable? I don’t know, but they are using a published model.
14/🧵
3) Vaccinating children counts for very little within this model. Is that reasonable? I don’t know, but they are using a published model.
14/🧵
Where are VIC and NSW currently in vax? I looked at data 2 weeks ago, to roughly account for lag in vax effectiveness. 1 does is 2/3 as effective as 2 doses (for both AZ and Pfizer) in Doherty model. That gives the following equivalents:
VIC = 41.0% 16+
NSW = 44.7% 16+
15/🧵
VIC = 41.0% 16+
NSW = 44.7% 16+
15/🧵
I used Doherty’s “oldest first” vax model (seems closest to real strategy), and extrapolated from 60/50% to VIC/NSW current levels.
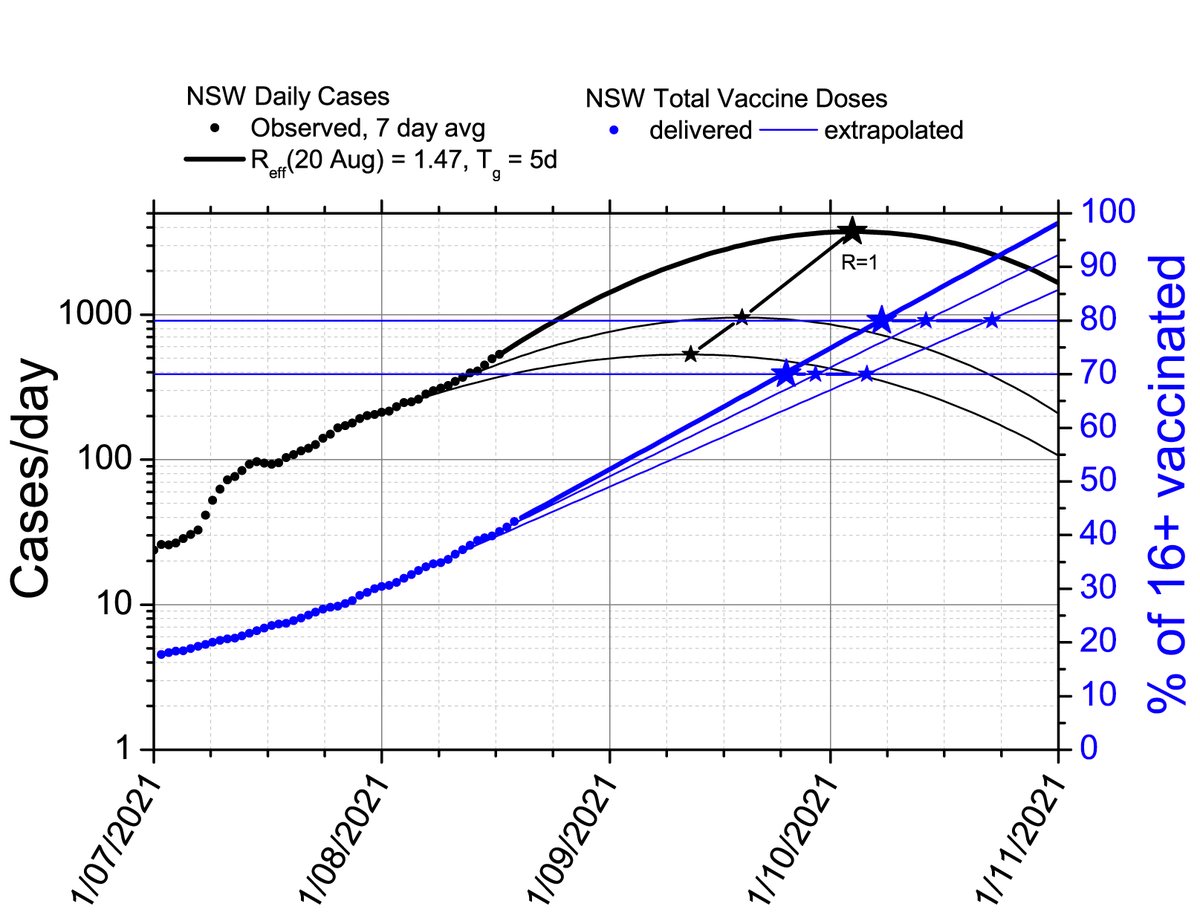
Finally, I want to match the observation that NSW has a current R = 1.31 assuming vax rate of 18/8/2021 and “partial” TTIQ.
16/🧵
Finally, I want to match the observation that NSW has a current R = 1.31 assuming vax rate of 18/8/2021 and “partial” TTIQ.
16/🧵
I assume that Doherty Institute’s estimates of PHSM effects are correct. Therefore I scaled R0 of delta to match the observations; I find a good match at R0 = 10.5. The result is below.
17/🧵
17/🧵

Assuming VIC current vax rate and “optimal” TTIQ, we expect R=1.12 for VIC. This is consistent with VIC barely losing control of its epidemic at “optimal” TTIQ, and now VIC probably has “partial” TTIQ where we expect R=1.38. This suggests the calibration is reasonable.
18/🧵
18/🧵
I don’t feel I can extrapolate Doherty’s model to higher vax rates, as the age-dependent effects are large toward the higher levels. However, I can estimate the size of the vaccination effect assuming a random transmission matrix.
19/🧵
19/🧵
I did this using the same assumptions as Doherty for vax effectiveness against onward txn for delta, using the published distribution of vax by age for NSW and VIC on 17/8/2021 (two weeks ago). I assume 60+ get AZ and <60 get Pfizer (not perfectly true!) The result:
20/🧵
20/🧵

Note that I need to assume a slightly lower current delta R0=9.4 to match the observations.
21/🧵
21/🧵
Taking these plots at face value, what do we learn?
At “optimal” TTIQ, 80% vax of 16+ is sufficient to remove “high” PHSM, and partly remove “medium” PHSM in both versions. “Optimal” TTIQ + 70% vax is marginal to remove “high” PHSM.
22/🧵
At “optimal” TTIQ, 80% vax of 16+ is sufficient to remove “high” PHSM, and partly remove “medium” PHSM in both versions. “Optimal” TTIQ + 70% vax is marginal to remove “high” PHSM.
22/🧵
At “partial” TTIQ, 80% vax of 16+ is insufficient to exit “high” PHSM (Stage 4 lockdown). Safe exit of Stage 4 will require >80% vax of 16+ at high caseloads (current NSW conditions).
23/🧵
23/🧵
Overall, the adjustment of Doherty to match the conditions on the ground indicates you’d need an additional ~10% vax to match the assumptions of the original report. It makes a difference of about one PHSM level (low/med/high) at any given vax level.
24/🧵
24/🧵
Possible problems with the assumptions:
25/🧵
25/🧵
1) I get a large R0 for delta. R0 is unknown and not an intrinsic property, rather depends on the human environment.
26/🧵
26/🧵
Doherty calibrated to produce a certain TP at baseline PHSM and optimal TTIQ. So equivalently, adjust R0 is similar to adjusting the effectiveness of baseline PHSM. (I get TP=3.9 at baseline+optimal.)
27/🧵
27/🧵
2) It’s possible that lockdowns are less effective now due to compliance. This would be good news. If “med” and “high” PHSM boxes are smaller, then R0 is smaller, and vax is relatively more effective, and we will have an easier time relaxing med/high PHSMs.
28/🧵
28/🧵
3) Vax effectiveness might be different that Doherty assumes. That’s probably bad news, as the lever arm of increased vax effectiveness becomes relatively smaller compared to PHSMs.
29/🧵
29/🧵
Doherty Institute does assume an age-dependent transmission matrix which predicts a larger vax effect. But, assuming a random transmission model doesn’t change things a lot (see above).
30/🧵
30/🧵
4) TTIQ might be worse now in NSW than Doherty assumes. That’s good news, similar to assuming PHSMs are less effective. TTIQ might also get worse later (that’s equivalent to saying it is not at rock-bottom now!) That would be bad news, making it harder to remove PHSMs.
31/🧵
31/🧵
5) I left out vax for <16s. We will start vaxxing 12-15s in a couple weeks. That’s good news. Vaxxing 80% of 12-15s is equivalent of adding 4% to the random-transmission vaccination levels. Smaller effect in the Doherty model is kids are less important in transmission.
32/🧵
32/🧵
Here is the plot including 12+ assuming random transmission:
33/🧵
33/🧵

Bottom line:
Assumptions in Doherty report don’t match observed transmission potential, likely because delta has higher R0 or higher R at baseline PHSM.
Need another ~10% vax, or ~5% vax plus vax of 12-15s, to reach similar protection anticipated in Doherty models.
34/34
Assumptions in Doherty report don’t match observed transmission potential, likely because delta has higher R0 or higher R at baseline PHSM.
Need another ~10% vax, or ~5% vax plus vax of 12-15s, to reach similar protection anticipated in Doherty models.
34/34
• • •
Missing some Tweet in this thread? You can try to
force a refresh