Some first impressions from the OzSAGE model (ozsage.org/icu-modelling/):

1)Not enough info is given to understand how the model works. They don’t explain how R_eff is calculated, for example, from the restriction settings.

@RichardfromSyd1 @OrinCordus @RageSheen @Globalbiosec
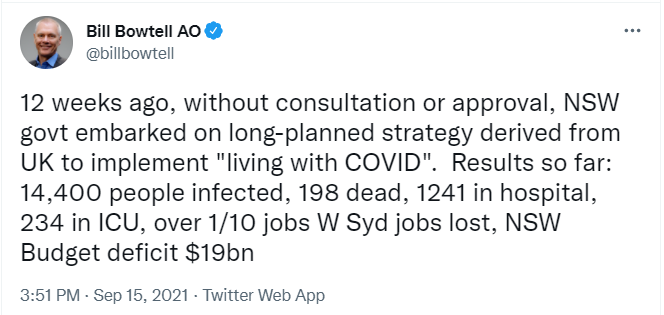
2)They don’t explain their assumptions about ongoing vaccination beyond 80%. This is key to understanding the model and it’s left unstated.
3)They say they adapt a peer-reviewed model, but that model was not used to model time-varying restrictions, and in fact did not include masks or lockdowns at all.
4)They appear to use vaccine effectiveness against infection when they should use vaccine effectiveness against transmission (which is much higher). So it appears that the vaccine effectiveness they use is much lower than Doherty, ANU model, Grattan?
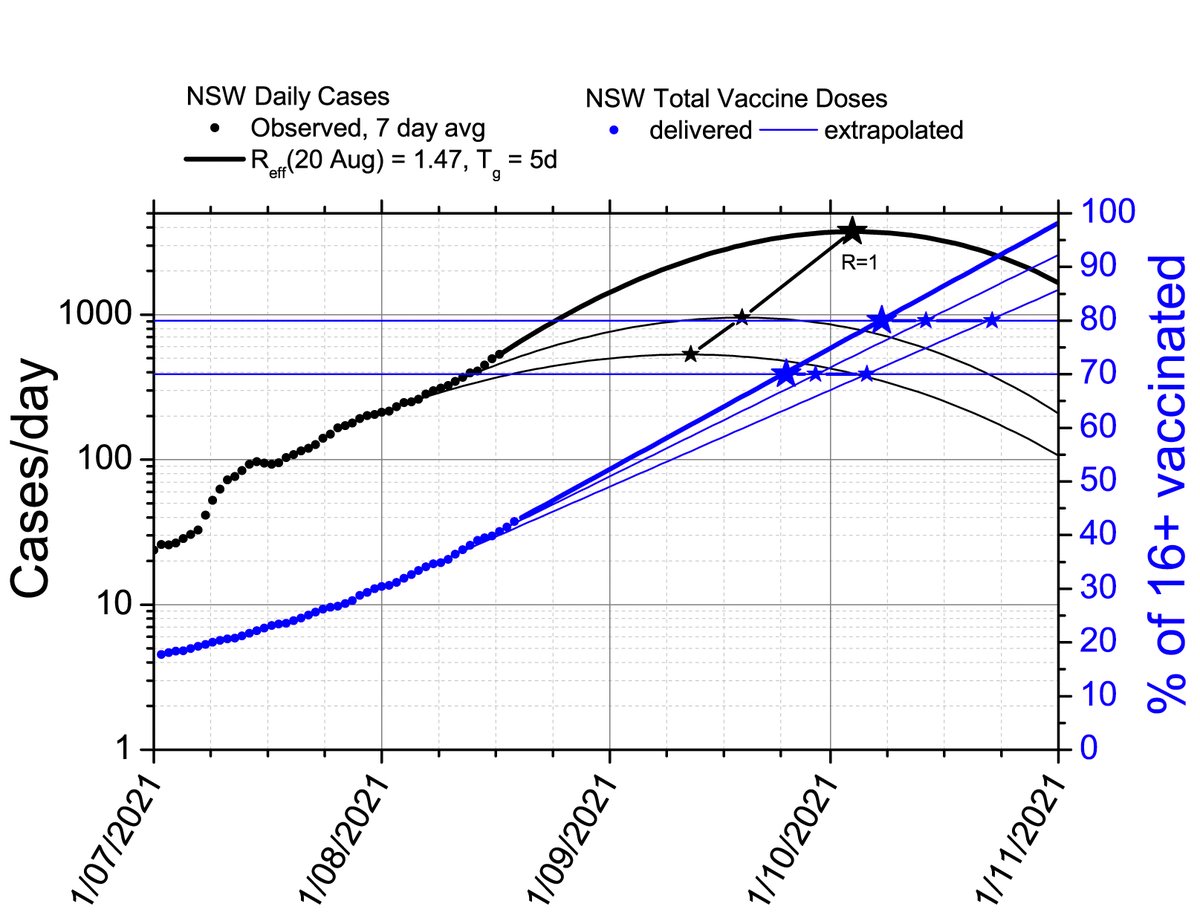
5)Calibration of the model is poor. Doherty at least calibrates all their assumptions on previous observations in NSW and VIC. This model takes only the current outbreak in NSW (cases/day in all NSW) and uses that single time trace to calibrate three parameters of the model...
... (which presumably all affect a single variable R_eff). It appears impossible to deconvolve the three effects, so their relative size in the model appears to be just a guess?
6)Surprisingly, given that they are free to adjust the parameters, they obtain a poor fit of their model to the observed time series. It is also likely to be proven wrong with a week or two! ... Image
...If the caseload is much lower than 1890 on 18 October, this will justify treating the model as pessimistic (though in fact it is just means it is poorly calibrated).
7)Assumptions about the post-lockdown conditions appear to be guesses. Guesses relative to the guesses about lockdown conditions. No justification for these settings is given, so in principle they could have put in any numbers to produce whatever outcome was desired.
8)They pick some fairly fine-tuned numbers for the post-lockdown conditions in some cases (46% or 44% movement restrictions, for example). They could have picked anything. In fact, they presumably could have picked settings that caused the peak to diverge much higher...
... It looks to me like they chose parameters to produce results that look “reasonable”. But I’d need to play with their model to know (and they don’t give enough details to do that!)
Summary:
This is not a peer-reviewed model, and the assumptions are not stated with enough transparency that it could be reproduced by others. Some assumptions are clearly arbitrary. It appears rushed, so perhaps some of these criticisms can be addressed in a revised version.

• • •

Missing some Tweet in this thread? You can try to force a refresh
 

Keep Current with Michael S Fuhrer

Michael S Fuhrer Profile picture

Stay in touch and get notified when new unrolls are available from this author!

Read all threads

This Thread may be Removed Anytime!

PDF

Twitter may remove this content at anytime! Save it as PDF for later use!

Try unrolling a thread yourself!

how to unroll video
  1. Follow @ThreadReaderApp to mention us!

  2. From a Twitter thread mention us with a keyword "unroll"
@threadreaderapp unroll

Practice here first or read more on our help page!

More from @MichaelSFuhrer

15 Sep
The UK is often held up as a cautionary tale regarding covid and re-opening.

Let's have a look at what happened in the UK and see if there are parallels to what is happening in Australia.

Thread.
1/🧵 Image
At the beginning of 2021 the UK was fighting a crushing wave of alpha with months of lockdown. As that wave receded, the UK began to release restrictions.

2/🧵
Restrictions were released at a very early stage of the vaccination program:

The UK "picnic day" and end of local-area restrictions to movement occurred on 29 March at 5.6% of total population vaxxed.

Outdoor dining/pubs opened 12 April at 11.5% vax.

3/ 🧵
Read 12 tweets
1 Sep
Here is a long/technical thread on my attempt to reverse-engineer the assumptions from the Doherty Institute report to the National Cabinet (linked) regarding delta severity, PHSM effectiveness, and vaccine effectiveness to match observations.
1/🧵
doherty.edu.au/uploads/conten…
Here are the figures from the Doherty Institute report. Note that there are a couple versions of these figures in the report; these assume the “all adults” strategy for vaccination.
2/🧵
The figures attempt to show graphically the effect of various interventions on the transmission potential (TP). TP is in essence R_eff, but calculated on the population level, as I understand it. When TP>1, cases grow, and TP<1, cases decline.
3/🧵
Read 34 tweets
28 Aug
This blog post has received a lot of attention.

A thread.
🧵
In short, the blog post takes public misconceptions about the technical report from Doherty, makes a cursory read of the report, repeats misconceptions, accuses Doherty of intentional scientific misconduct to lead Australia to disaster.

Crackpot stuff.
2/🧵
Not really worth taking apart. But it’s been retweeted by a number of figures who should really know better. So let’s take a look.

Doherty Institute report is here if you want to read along.

3/🧵
doherty.edu.au/uploads/conten…
Read 24 tweets
23 Aug
It is mind-boggling how fast one’s worldview needs to adapt to changing reality during this pandemic.

Taking stock of some new realities:
🧵
1) Delta is tougher than we thought. It is now safe to say that, even at current vax, delta is marginal to escape optimal TTI + lockdown. Some outbreaks fizzle out. But when they don’t, short/sharp lockdowns have become long at best, uncontrolled outbreaks at worst...
...This is ultimately inevitable, and your risk analysis for vax should account for the fact that everywhere is either in outbreak now or only months/weeks from outbreak. Get whatever vax is available to you, as soon as possible, and encourage everyone you know to do the same.
Read 11 tweets
21 Aug
10 days ago it was conceivable that NSW could control delta and reach low covid (by int'l standards) well before 80% vax, safely open and reduce covid simultaneously.

Now appears that NSW will barely control covid, at high caseloads (~500/Mpop/day) when reaching 80% vax.
1/ Image
Lines on the graph are extrapolations from 9, 14, and 20 August. In 11 days the extrapolated date of effective* 80% vax of 16+ has moved forward 15 days, and the date of achieving R=1 through vax has moved backwards by 22 days. Separation has gone from 6 weeks to 4 days.
2/
This is a result of the higher observed R, which seems robust.

Likely scenario: NSW will achieve 80% vax of 16+ in October after 3.5 months lockdown, with cases in several 1,000s/day. Pressure to remove lockdown will be intense.
3/
Read 6 tweets

Did Thread Reader help you today?

Support us! We are indie developers!


This site is made by just two indie developers on a laptop doing marketing, support and development! Read more about the story.

Become a Premium Member ($3/month or $30/year) and get exclusive features!

Become Premium

Too expensive? Make a small donation by buying us coffee ($5) or help with server cost ($10)

Donate via Paypal Become our Patreon

Thank you for your support!

Follow Us on Twitter!

:(