It's the weekend!
Grab a cup of coffee, in this thread I will explain
1. What are Valuation Ratios?
2. What ratio should be used when?
3. Why one standard ratio like a PE doesn't work all the time?
Lets dive right in.
Grab a cup of coffee, in this thread I will explain
1. What are Valuation Ratios?
2. What ratio should be used when?
3. Why one standard ratio like a PE doesn't work all the time?
Lets dive right in.

Valuation Ratios are a subset of ratios within the broader family of Ratio Analysis.

It is in this segment of Ratio Analysis, that you will find ratios like Price to Earnings, Price to Book, Price to Cash Flow, Price to Sales and many more.
Together these ratios help an investor understand if a company is valued cheap or expensive.

A novice investor tends to use Price to Earnings (PE) for everything - yet it is only one of the many ratios that should be used to judge the current valuation of a company.
When it comes to valuation esp. via Ratio Analysis - you cannot judge the valuation in isolation by using a single ratio.
You have to consider multiple characteristics and factors together while valuing a company.
You have to consider multiple characteristics and factors together while valuing a company.

More so, you need to understand what ratio to use when.
A Price to Book (PB) ratio doesn't work for companies with low assets and book values while it works perfectly for companies that are asset heavy.
A Price to Book (PB) ratio doesn't work for companies with low assets and book values while it works perfectly for companies that are asset heavy.
So lets explore in detail, what each ratio means, what does it tell you about a company and what are the many pros and cons of using them.
Our first ratio is perhaps the most popular of them all - Price to Earnings or PE.

As the ratio suggests, Price to Earnings is just the current market price of a company divided by its most recent full year earnings per share.

This ratio is essentially telling you how much you're paying today for each Rupee earned per share.
Assuming the company passes on entire earnings as dividends, this ratio will also denote the number of years it takes for you to recoup your investment at the current share price.
Assuming the company passes on entire earnings as dividends, this ratio will also denote the number of years it takes for you to recoup your investment at the current share price.
Pros
1⃣ Easy to understand
2⃣ Quick tool to compare across peers
3⃣ Widely used
Cons
1⃣ Earnings per share is a highly managed accounting number
2⃣ Doesn't work for companies that have zero or negative earnings
3⃣ Doesn't reflect components of Balance Sheet like Debt
1⃣ Easy to understand
2⃣ Quick tool to compare across peers
3⃣ Widely used
Cons
1⃣ Earnings per share is a highly managed accounting number
2⃣ Doesn't work for companies that have zero or negative earnings
3⃣ Doesn't reflect components of Balance Sheet like Debt
Here is something that is not taught a lot yet I believe is very simple tool for a new investor to understand.
If you flip the ratio of P/E to Earnings/Price, you get something known as an Earnings Yield.
If you flip the ratio of P/E to Earnings/Price, you get something known as an Earnings Yield.

Yield refers to how much return an investment generates.
If a fixed deposit gives you 6% return, then its yield is said to be 6%.
Similarly a
PE ratio of 25 means an Earnings Yield of 4%
(1/25 = 0.04)
PE ratio of 100 means an Earnings Yield of 1%
(1/100 = 0.01)
If a fixed deposit gives you 6% return, then its yield is said to be 6%.
Similarly a
PE ratio of 25 means an Earnings Yield of 4%
(1/25 = 0.04)
PE ratio of 100 means an Earnings Yield of 1%
(1/100 = 0.01)
Suddenly those stocks with a PE of 100 and beyond, don't look so good, do they?
When is PE suitable to use?
PE is good ratio to use when
1⃣ A company has earnings
2⃣ The company isn't cyclical, financial or in an asset heavy industry
3⃣ When you want to do a quick compare of peers in the industry
PE is good ratio to use when
1⃣ A company has earnings
2⃣ The company isn't cyclical, financial or in an asset heavy industry
3⃣ When you want to do a quick compare of peers in the industry
In any other case, PE is not suitable to use on it own. You always have to use these ratios in conjunction with various other metrics like
1⃣ Profit Margins
2⃣ Growth in Earnings
3⃣ Industry Structure
4⃣ Company Structure
5⃣ Cash Flows
Never invest just based on a single ratio.
1⃣ Profit Margins
2⃣ Growth in Earnings
3⃣ Industry Structure
4⃣ Company Structure
5⃣ Cash Flows
Never invest just based on a single ratio.
An offshoot of PE is a ratio called PEG or Price to Earnings Growth.

Instead of just one time Earnings, this ratio changes the denominator to Earnings Growth.
This is a good ratio to use esp for fast growing companies, provided the growth in earnings is sustainable.
This is a good ratio to use esp for fast growing companies, provided the growth in earnings is sustainable.

PEG Ratio of > 1 implies the company is overvalued
PEG Ratio of < 1 implies the company is undervalued
PEG Ratio of < 1 implies the company is undervalued
Fun Fact: Peter Lynch popularized the use of PEG Ratio through his book One Up on Wall Street.

Let's explore another valuation ratio.
Price to Sales
Price to Sales is just what the name suggests.
Current Share Price / Most recent 12 month Sales per Share
Price to Sales is just what the name suggests.
Current Share Price / Most recent 12 month Sales per Share

Price to Sales is a relative valuation ratio - it is used to compare how cheap/expensive a company is valued in relation to its peers in the industry.
This is mostly used for companies that aren't earning any revenue yet and do not have a positive net income.
This is mostly used for companies that aren't earning any revenue yet and do not have a positive net income.

Pros
1⃣ Less susceptible to accounting shenanigans: Sales of a company cannot be altered easily
2⃣ Sales unlike earnings for most part are not as volatile and relatively stable for company
1⃣ Less susceptible to accounting shenanigans: Sales of a company cannot be altered easily
2⃣ Sales unlike earnings for most part are not as volatile and relatively stable for company
Cons
1⃣ Does not take into account profitability
A company may be doing 100cr in sales every year but if its profit margin is 1% on that 100cr, its Price to Sales ratio will be very less but that alone doesn't make it a good investment
1⃣ Does not take into account profitability
A company may be doing 100cr in sales every year but if its profit margin is 1% on that 100cr, its Price to Sales ratio will be very less but that alone doesn't make it a good investment
Just like with PE, Price to Sales too need to be evaluated in conjunction with other metrics.
When to use Price to Sales?
1⃣ To compare companies across the industry and establish a benchmark ratio
2⃣ When a company isn't reporting any or low earnings and is in its growth phase
1⃣ To compare companies across the industry and establish a benchmark ratio
2⃣ When a company isn't reporting any or low earnings and is in its growth phase
An offshoot of Price to Sales is a ratio called Enterprise Value to Sales.
In this instead of taking Current Share Price / Sales per Share
we take the total
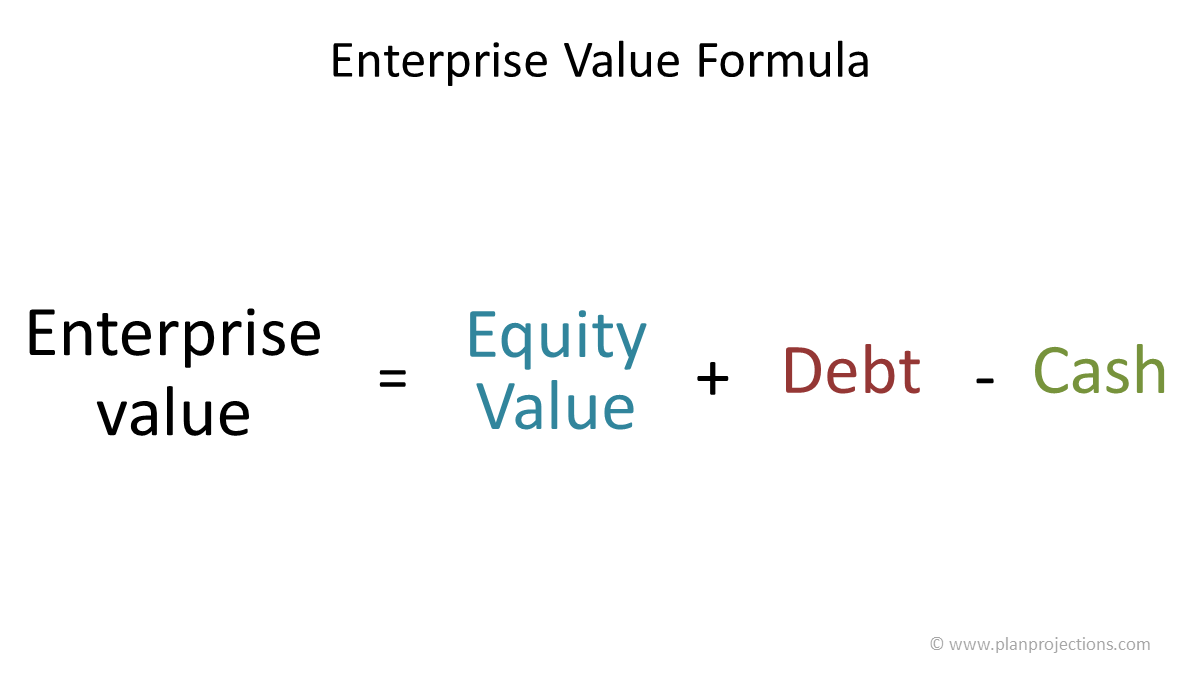
Enterprise Value = (Value of Debt + Value of Equity - Net Cash)
and divide it with the actual yearly sales number.
In this instead of taking Current Share Price / Sales per Share
we take the total
Enterprise Value = (Value of Debt + Value of Equity - Net Cash)
and divide it with the actual yearly sales number.

The main difference between EV to Sales and Price to Sales is that EV to Sales incorporates the Balance Sheet elements (Debt and Cash) in the ratio which Price to Sales does not.
EV to Sales gives a more comprehensive picture by incorporating the leverage (debt) of the company.
EV to Sales gives a more comprehensive picture by incorporating the leverage (debt) of the company.
Price to Cash Flow
Price to Cash Flow is a measure of current market value relative to the cash generated by a business.
It is measured as
Current Share Price / Cash Flow per Share
Price to Cash Flow is a measure of current market value relative to the cash generated by a business.
It is measured as
Current Share Price / Cash Flow per Share

The ratio is basically telling you how much you're paying for a company today for each rupee of future expected cash flow.
This is my go to ratio and I particularly like using this while screening stocks as it has several pros and limited cons.
Pros
1⃣ Unlike earnings, cash flow is very hard to manipulate
2⃣ Companies that do not have net earnings yet, can easily be compared on the basis of cash flow
Cons
1⃣ Doesn't incorporate Balance Sheet Leverage (Debt)
2⃣ Doesn't incorporate Growth in Cash Flow
1⃣ Unlike earnings, cash flow is very hard to manipulate
2⃣ Companies that do not have net earnings yet, can easily be compared on the basis of cash flow
Cons
1⃣ Doesn't incorporate Balance Sheet Leverage (Debt)
2⃣ Doesn't incorporate Growth in Cash Flow
When to use Price to Cash Flow?
Price to Cash Flow is most suitable to be used when evaluating Technology Product companies or companies who have reoccurring revenues with a limited asset base.
Price to Cash Flow is most suitable to be used when evaluating Technology Product companies or companies who have reoccurring revenues with a limited asset base.
Most tech companies generate a very high cash flow yet they reinvest most of it into growing the company via Research and Development costs.
As such, these companies either do not have positive net earnings or if they do then these earnings are miniscule compared to cash flow.
As such, these companies either do not have positive net earnings or if they do then these earnings are miniscule compared to cash flow.

Using Price to Cash Flow to evaluate such businesses will give you far more clarity than using a Price to Earnings ratio would.
An offshoot of Price to Cash Flow is Price to Free Cash Flow.
Here, in the denominator instead of Cash Flow from Operations, we use Free Cash Flow.
Price to FCF, incorporates the effects of cash used by the companies for investing and financing purposes.
Here, in the denominator instead of Cash Flow from Operations, we use Free Cash Flow.
Price to FCF, incorporates the effects of cash used by the companies for investing and financing purposes.

Price to Book or PB
As the name suggests,
Price to Book is ratio of current share price / most recent per share book value of the firm.
As the name suggests,
Price to Book is ratio of current share price / most recent per share book value of the firm.

Book Value refers to the Net Assets available to a company's shareholders.
In case a company is liquidated this is the expected value each shareholder can expect to receive (at least theoretically).
In case a company is liquidated this is the expected value each shareholder can expect to receive (at least theoretically).

When to use?
Financial and asset heavy cyclical companies are best evaluated
using a Price to Book ratio.
The firms have a high asset base and due to the cyclical nature of their business peak earnings from these assets are achieved only in certain years.
Financial and asset heavy cyclical companies are best evaluated
using a Price to Book ratio.
The firms have a high asset base and due to the cyclical nature of their business peak earnings from these assets are achieved only in certain years.

You cannot evaluate a technology company using a price to book ratio.
Why?
Cause technology companies do not need significant assets to conduct their business.
A true tech company will have a very small asset base and really high cash flow from that asset base.
Why?
Cause technology companies do not need significant assets to conduct their business.
A true tech company will have a very small asset base and really high cash flow from that asset base.
Using a Price to Book ratio when a company has asset light balance sheet will not provide any information to you as an investor.
Pros
1⃣ Stable metric, the book value of a company doesn't fluctuate as much as earnings would
2⃣ Can be used to evaluate financial and cyclical companies
Cons
1⃣ Doesn't tell you anything about profitability of a company
1⃣ Stable metric, the book value of a company doesn't fluctuate as much as earnings would
2⃣ Can be used to evaluate financial and cyclical companies
Cons
1⃣ Doesn't tell you anything about profitability of a company
The final ratio we will discuss today is called
EV to EBITDA
EV to EBITDA

EV to EBITDA, takes the
Enterprise Value = (Value of Debt + Value of Equity - Net Cash)
and divides that with
Earnings Before Interest, Tax, Depreciation and Amortization (also known as a proxy for cash flow)
Enterprise Value = (Value of Debt + Value of Equity - Net Cash)
and divides that with
Earnings Before Interest, Tax, Depreciation and Amortization (also known as a proxy for cash flow)
This is another one of my go to ratios to use as it essentially takes all the funds available to a company to use in the form of equity and debt and tells you how much cash a company is able to generate using those funds.
A EV by EBITDA ratio of 10 means you would have to pay 10 times yearly cash flow to acquire the entire business.
Pros
1⃣ Incorporates Balance Sheet elements like Debt
2⃣ Links Balance Sheet to Cash Flows
Cons
1⃣ Doesn't tell you anything about growth in earnings or cash flows
1⃣ Incorporates Balance Sheet elements like Debt
2⃣ Links Balance Sheet to Cash Flows
Cons
1⃣ Doesn't tell you anything about growth in earnings or cash flows
Finally, lets answer what is a good ratio to use?

There is no single good ratio to judge an investment and company. You as an investor have to use multiple ratios and metrics to understand an entire company.
Every company is different and all ratios taken together can help you decipher an investment from all angles.
Every company is different and all ratios taken together can help you decipher an investment from all angles.

Just like Valuation Ratios, you have Profitability and Capital Efficiency ratios like ROE, ROIC and ROCE.
Learn all about them in this thread below.
Learn all about them in this thread below.
https://twitter.com/itsTarH/status/1413768405237207041?s=20
If you're new here, I write a thread every weekend, explaining an investing concept.
Here is a link to my last weekend's thread
Here is a link to my last weekend's thread
https://twitter.com/itsTarH/status/1429021991571386371?s=20
I am an advocate of visual learning and visualizing numbers beyond the excel sheets
Teach a Free class on Data Visualizing using a tool called Tableau over @skillshare
Get access to the class by using the below link
skl.sh/2XNug6A
Teach a Free class on Data Visualizing using a tool called Tableau over @skillshare
Get access to the class by using the below link
skl.sh/2XNug6A
https://twitter.com/itsTarH/status/1427993843127906304?s=20
I also teach a class on Personal Finance - concepts and frameworks that helped me achieve Financial Independence Early.
Here is a link to that class
(gives you Free access to all other classes on Skillshare for 30 days)
skl.sh/2Wjk7A7
Here is a link to that class
(gives you Free access to all other classes on Skillshare for 30 days)
skl.sh/2Wjk7A7
https://twitter.com/itsTarH/status/1419694448892514311?s=20
Also, write and publish long from articles on my substack (investkaroindia.substack.com)
Subscribe for free, if you're interested.
Thank you to the 2500+ of you who already have!
Subscribe for free, if you're interested.
Thank you to the 2500+ of you who already have!
Here, is a link to my last Deep Dive into PolicyBazaar.
investkaroindia.substack.com/p/policybazaar…
investkaroindia.substack.com/p/policybazaar…
If you find this thread useful then follow me
@itsTarH
I write a new thread every weekend.
All my previous work, can be found here.
@itsTarH
I write a new thread every weekend.
All my previous work, can be found here.
https://twitter.com/itsTarH/status/1401095938945425410?s=20
Thank you for reading, please retweet the first tweet in this thread for a broader reach.
See you all next weekend!
See you all next weekend!
• • •
Missing some Tweet in this thread? You can try to
force a refresh