It's the weekend!
Grab a cup of coffee, in this thread I will explain
1. What is a Balance Sheet?
2. Why is it important?
3. What does it tell you about a business?
Lets dive right in.
Grab a cup of coffee, in this thread I will explain
1. What is a Balance Sheet?
2. Why is it important?
3. What does it tell you about a business?
Lets dive right in.

A Balance Sheet is a summary of a company's financials and the underlying business.

Think of it as a store front of a company.
You go to an Apple Store because it looks like this.

Will you visit it, if it looked like this?

A good balance sheet looks very similar to the Apple Store example above.
Its pristine!
Its pristine!
A bad balance sheet on the other hand - looks grim, shabby and on the verge of a collapse.
Just by looking at a balance sheet, you can tell if a business is doing well for itself and will survive a downturn or will perish at the first instance of headwinds.
This is what a typical Balance Sheet looks like.

It has three parts to it.
Assets, Liabilities and Shareholders Equity
Assets, Liabilities and Shareholders Equity

The Golden Equation for Balance Sheet is
Assets = Liabilities + Shareholders Equity
Assets = Liabilities + Shareholders Equity

Why is this a golden equation and what does it tell you?

Assets represent everything that a company owns.
These are the places where a company chose to spend its money.
They can be in the form of plant, machinery, R&D expenses, Investments, Blocked Capital for In Progress Assets etc.
These are the places where a company chose to spend its money.
They can be in the form of plant, machinery, R&D expenses, Investments, Blocked Capital for In Progress Assets etc.

Liabilities and Shareholders Equity together represent the sources of funds for a company.

There are only three ways a company can get funds
1. Saving its Previous Profits = Reserves
2. Borrowing Money = Debt
3. Selling a portion of business to public/private = Shareholders Equity
1. Saving its Previous Profits = Reserves
2. Borrowing Money = Debt
3. Selling a portion of business to public/private = Shareholders Equity

At any given point in time,
Total Expenditure by a company = Total Sources of Funds
Hence, the golden equation of
Assets = Liabilities + Shareholders Equity
Total Expenditure by a company = Total Sources of Funds
Hence, the golden equation of
Assets = Liabilities + Shareholders Equity
A Balance Sheet is important because it tells you how a company is using the funds available to it
(Liabilities + Shareholders Equity),
to manage and increase its business (Assets).
(Liabilities + Shareholders Equity),
to manage and increase its business (Assets).
If a company is taking on too much debt and investing in Assets that return less than cost of debt, then its a bad case of capital allocation.

Its equivalent to you taking a personal loan at 12% per year to invest in a bank fixed deposit that returns 6% per year.
Lets explore each component of a Balance Sheet in detail.
We will first start with Liabilities.

There are two types of Liabilities.
1. Current Liability
2. Non Current Liability
1. Current Liability
2. Non Current Liability
Current Liability = Due in less than 12 months

Non Current Liability = Due in more than 12 months

If you have an EMI that is due next month, that's your current liability.
The loan that you do not have to return until next year, that's your non current liability.
The loan that you do not have to return until next year, that's your non current liability.
Together Current and Non Current Liabilities can be grouped into three broad categories for analysis.
1. Borrowings (Short Term and Long Term)
2. Trade Payables (Money owed to suppliers)
3. Advance from Customers
1. Borrowings (Short Term and Long Term)
2. Trade Payables (Money owed to suppliers)
3. Advance from Customers

You will notice the common theme of all three categories in each case money is being lend to the company.
We will explore later in this thread how to analyze these with the help of ratios.
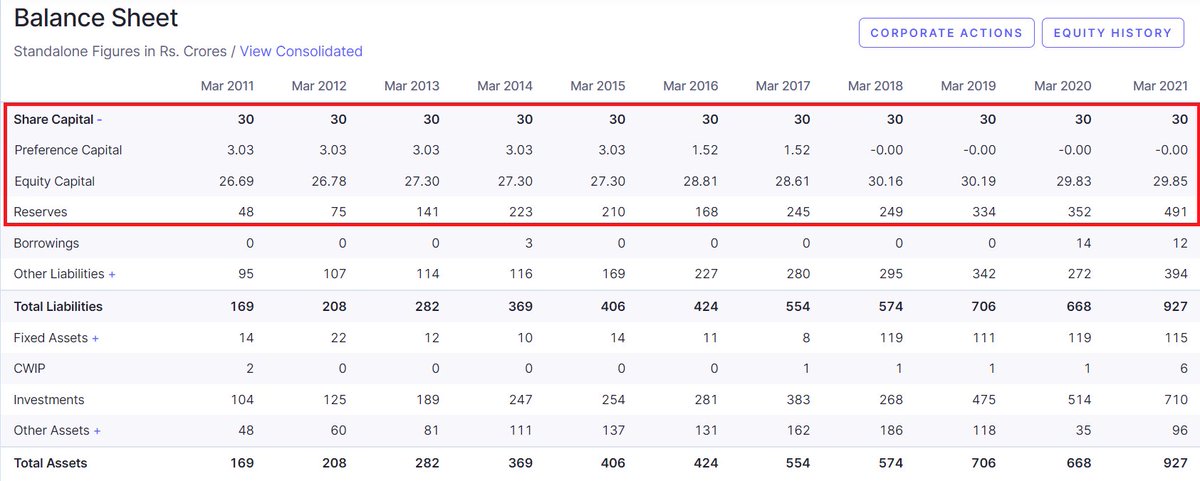
Shareholders Equity is made up of
Share Capital = Money raised by company by issuing shares
Reserves = Portion of previous years profits saved by the company
Share Capital = Money raised by company by issuing shares
Reserves = Portion of previous years profits saved by the company
The common theme of Shareholders Equity is money lend to the company by issuing shares of the business.

Reserves also belong to Shareholder Equity as these are profits retained by the company.
These profits were generated by funds provided by shareholders and hence belong to shareholders.
These profits were generated by funds provided by shareholders and hence belong to shareholders.
Lets now explore Assets side of the Balance Sheet.
Just like Liabilities, Assets too are divided into two main parts
Current Assets = Money due in less than 12 months
Non Current Assets = Money due in more than 12 months
Current Assets = Money due in less than 12 months
Non Current Assets = Money due in more than 12 months

Broadly both current and non current assets can be classified into the following categories.
1. Fixed Assets
2. Investments
3. Other Assets (Cash, Receivables, Advance Tax Paid, etc.)
1. Fixed Assets
2. Investments
3. Other Assets (Cash, Receivables, Advance Tax Paid, etc.)

With the help of a few ratios
we can understand how well a business is allocating capital
and if the Balance Sheet is like
the Apple Store from our example above,
or the shabby joint that looks almost haunted.
we can understand how well a business is allocating capital
and if the Balance Sheet is like
the Apple Store from our example above,
or the shabby joint that looks almost haunted.
The most important Balance Sheet Ratio is Debt to Equity.

Debt to Equity tells you how levered the business is and what is its capital structure.

A low Debt to Equity ratio is favorable as that means a business doesn't have enough debt and has a higher probability of surviving in case of downturns.
Its very hard for a business to go bankrupt if it doesn't owe money to anyone.
Ideal Debt to Equity Ratio is 0.5 and anything greater than 2 is considered risky.

How do you calculate Debt to Equity?
Add All Debt (short and long term) / Total Shareholders Equity
Add All Debt (short and long term) / Total Shareholders Equity

A related ratio to Debt to Equity is Debt Service Coverage Ratio (DSCR).
DSCR tells you how well a company can service its debt (continue to make interest payments on borrowed money).
DSCR tells you how well a company can service its debt (continue to make interest payments on borrowed money).

Its calculated by dividing
Net Operating Income (Total Yearly Income or EBIT) by Total Yearly Interest Payments.
Net Operating Income (Total Yearly Income or EBIT) by Total Yearly Interest Payments.

The next ratio helps us figure out if a company has enough short term assets to pay its short term bills.
This ratio is known as current ratio.
This ratio is known as current ratio.

Current Ratio is very simple to calculate.
Just divided Current Assets from Current Liabilities.
Just divided Current Assets from Current Liabilities.

A current ratio higher than 1.5 is good and anything less than that is bad.
Current Ratio
1.5 = Ideal, has enough cash to meet short term liabilities
> 1.5 = Hoarding cash, needs investigation
< 1 = Doesn't have enough short term cash (Risky)
1.5 = Ideal, has enough cash to meet short term liabilities
> 1.5 = Hoarding cash, needs investigation
< 1 = Doesn't have enough short term cash (Risky)
An offshoot of Current Ratio is called a Quick Ratio.
Quick Ratio takes the same Current Ratio formula, but removes Inventories from Current Assets.
Why?
Cause inventories cannot be converted to cash immediately.
Quick Ratio takes the same Current Ratio formula, but removes Inventories from Current Assets.
Why?
Cause inventories cannot be converted to cash immediately.
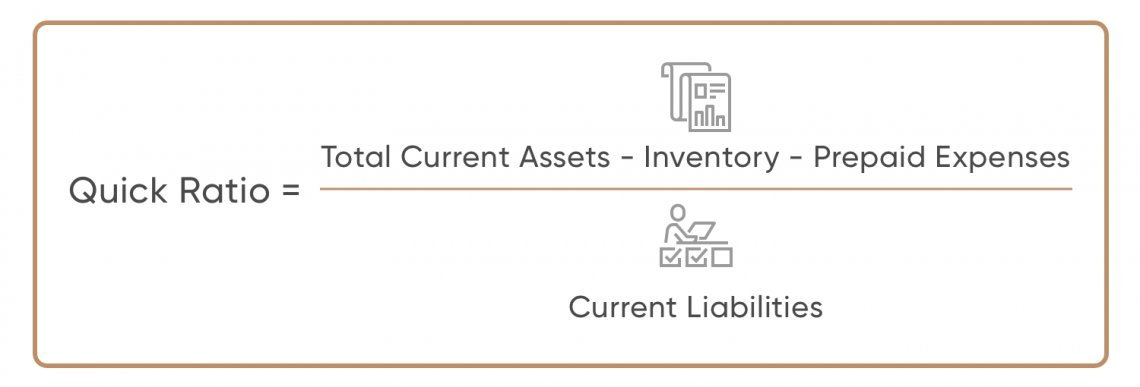
Quick Ratio helps you analyze if a company has enough short term liquid assets to meet its short term liabilities.
Next ratio, is called Working Capital.
Working Capital is the amount of money required by a business to run its day to day operations.

If you subtract Current Liabilities from Current Assets, you get the working capital.

Great Businesses have negative Working Capital.
They are basically using other people's money to run their own business.
Try to identify such businesses.
They are basically using other people's money to run their own business.
Try to identify such businesses.
There are a lot of other ratios in a Balance sheet that you can use, you can learn about all of them at the below link.
wallstreetmojo.com/balance-sheet-…
wallstreetmojo.com/balance-sheet-…

In Summary
1. Balance Sheet is a snapshot of a company
2. It tells you how well a business is managing its funds
3. Just by analyzing a few components of a balance sheet, you can identify if a business is superior or not
1. Balance Sheet is a snapshot of a company
2. It tells you how well a business is managing its funds
3. Just by analyzing a few components of a balance sheet, you can identify if a business is superior or not
While analyzing any business you should look at its financial statements in the below order
1. Balance Sheet
2. Cash Flow Statement
3. Profit and Loss Statement
1. Balance Sheet
2. Cash Flow Statement
3. Profit and Loss Statement
I hope, this thread helped you learn about Balance Sheet and its importance.
If you're new here, I write a thread every weekend, explaining an investing concept.
Here is a link to my last weekend's thread
If you're new here, I write a thread every weekend, explaining an investing concept.
Here is a link to my last weekend's thread
https://twitter.com/itsTarH/status/1431517369940119553?s=20
I am an advocate of visual learning and visualizing numbers beyond the excel sheets
Teach a Free class on Data Visualizing using a tool called Tableau over
@skillshare
Get access to the class by using the below link
skl.sh/2XNug6A
Teach a Free class on Data Visualizing using a tool called Tableau over
@skillshare
Get access to the class by using the below link
skl.sh/2XNug6A
https://twitter.com/itsTarH/status/1427993843127906304?s=20
I also teach a class on Personal Finance - concepts and frameworks that helped me achieve Financial Independence Early.
Here is a link to that class
(gives you Free access to all other classes on Skillshare for 30 days)
skl.sh/2Wjk7A7
Here is a link to that class
(gives you Free access to all other classes on Skillshare for 30 days)
skl.sh/2Wjk7A7
https://twitter.com/itsTarH/status/1419694448892514311?s=20
Also, write and publish long from articles on my substack (investkaroindia.substack.com/subscribe)
Subscribe for FREE, if you're interested.
Detailed write up on Nykaa getting published tomorrow!
Subscribe for FREE, if you're interested.
Detailed write up on Nykaa getting published tomorrow!
https://twitter.com/itsTarH/status/1433785325466251267?s=20
If you find this thread useful then follow me
@itsTarH
I write a new thread every weekend.
All my previous work, can be found here.
@itsTarH
I write a new thread every weekend.
All my previous work, can be found here.
https://twitter.com/itsTarH/status/1401095938945425410?s=20
Thank you for reading, please retweet the first tweet in this thread for a broader reach.
See you all next weekend!
See you all next weekend!
• • •
Missing some Tweet in this thread? You can try to
force a refresh