It's the weekend!
Grab a cup of coffee, in this thread I will explain
1. What is a Dividend Discount Model?
2. What are its main components?
3. How to use it to value a business?
Lets dive right in.
Grab a cup of coffee, in this thread I will explain
1. What is a Dividend Discount Model?
2. What are its main components?
3. How to use it to value a business?
Lets dive right in.

Before I explain what a Dividend Discount Mode is, lets understand what is the main crux of valuations? 

The entire reason behind valuing something is to determine, how much return your investment will generate within a specified period of time.
Return here stands for the cash flow generated by the asset.
Return here stands for the cash flow generated by the asset.

Every asset by its nature, will generate returns.
For Fixed Deposits = Returns are Interest Payments
For Real Estate = Returns are Rent Payments
For Debt Securities = Returns are coupon payments
For Stocks = Returns are Dividends + Any Appreciation in Stock Price
For Fixed Deposits = Returns are Interest Payments
For Real Estate = Returns are Rent Payments
For Debt Securities = Returns are coupon payments
For Stocks = Returns are Dividends + Any Appreciation in Stock Price
To perform the exercise of valuation means to determine what these returns are worth today.
Why?
Cause Rs 100 today is worth more than Rs 100, 10 years later.
Why?
Cause Rs 100 today is worth more than Rs 100, 10 years later.
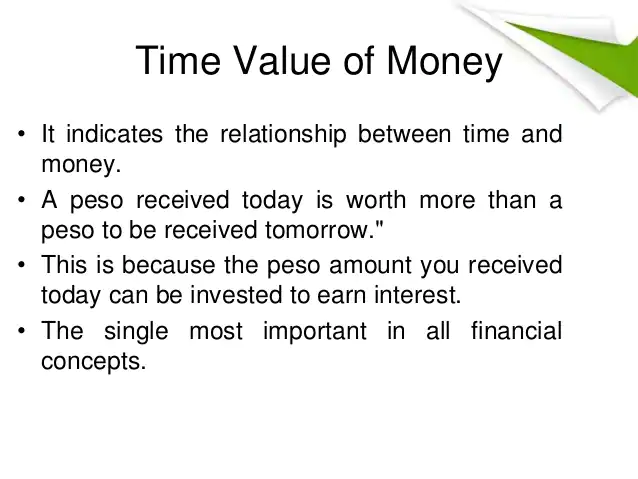
This exercise of determining what returns are worth today is also known as present value (the technical term used in the industry). 

There are entire books and research papers written on determining the present value of something using various models (and new ones are being developed everyday).
All of these models combined are known as Valuation Models.
Dividend Discount Model is one amongst them.
All of these models combined are known as Valuation Models.
Dividend Discount Model is one amongst them.
A dividend discount model is the easiest among all valuation models.
It states that the intrinsic value of a stock is the present value of all its future dividend combined.
It states that the intrinsic value of a stock is the present value of all its future dividend combined.

Lets understand what that means.
When you buy a stock, you're simply buying a piece of a business listed in the public markets.
Good businesses generate profits every year and since you own a piece (shares) of a profit generating business, you are entitled to received a part of those profits every year.
Good businesses generate profits every year and since you own a piece (shares) of a profit generating business, you are entitled to received a part of those profits every year.
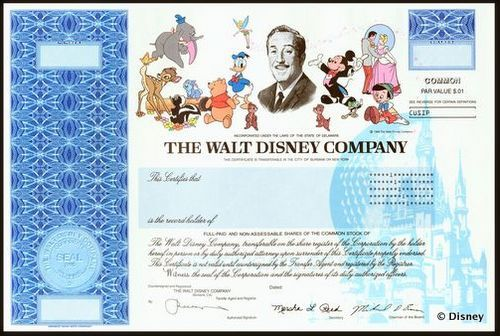
Companies pay out a part of their profits every quarter or yearly to their shareholders - these are known as dividends. 
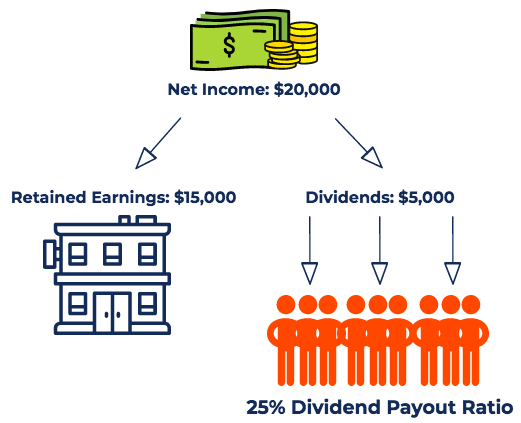
Let's assume you want to invest in a company for next 10 years.
Dividend Discount Model states that you can get a fair sense of the correct value of the stock if you can estimate how much dividend will be paid out by the company to you (the investor) during your holding period.
Dividend Discount Model states that you can get a fair sense of the correct value of the stock if you can estimate how much dividend will be paid out by the company to you (the investor) during your holding period.
There are many types of dividend discount models, the three main ones are
1. Single Period DDM
2. Multi Period DDM
3. Gordon Growth Model
1. Single Period DDM
2. Multi Period DDM
3. Gordon Growth Model
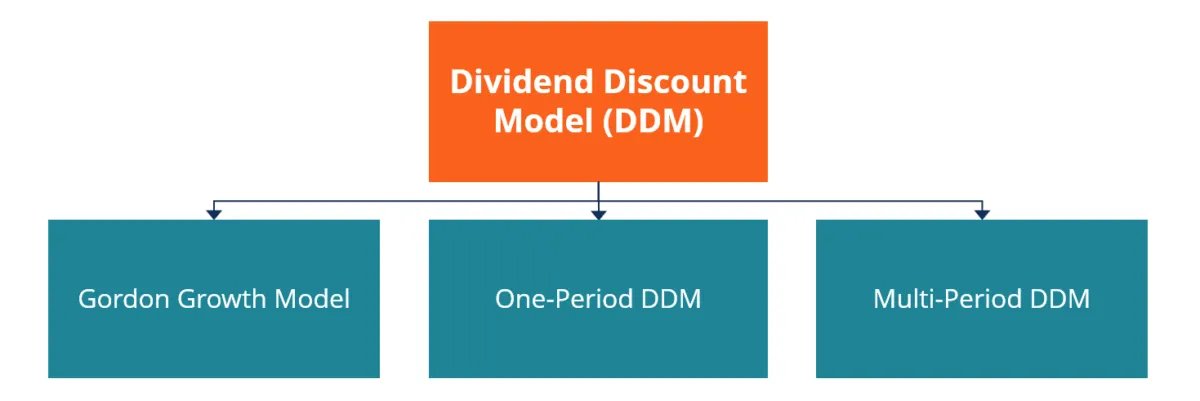
All of these models state a single thing - present value of all the future dividend paid out by the company is the fair value of the stock.
For example, Lets assume Hero Moto Corp, pays an yearly dividend of 50% of its profits.
If we can estimate profits and growth rate for the next 10 years, we can estimate the dividend we may receive and as such can arrive at the fair value of the stock.
If we can estimate profits and growth rate for the next 10 years, we can estimate the dividend we may receive and as such can arrive at the fair value of the stock.

I will explain later in this thread, how to discount these dividends to their present value.
So now you have a general idea of what a Dividend Discount Model is, lets explore what are its main components.
The formula may look complicated but its really easy.
PV = present value of the company (this is what we are estimating)
D1 = Dividend we will receive next year (assuming we are only buying the stock for one year)
r = Cost of Capital
g = Growth Rate
PV = present value of the company (this is what we are estimating)
D1 = Dividend we will receive next year (assuming we are only buying the stock for one year)
r = Cost of Capital
g = Growth Rate
Of these, the most important parts of are
1. Cost of Capital
2. Growth Rate
1. Cost of Capital
2. Growth Rate
What is Cost of Capital?
Cost of Capital simply refers to the cost of raising funds.
There are only two ways a company can raise funds
1. Borrow from a Bank or Institution (Debt)
2. Issues shares to potential investors (Equity)
Cost of Capital simply refers to the cost of raising funds.
There are only two ways a company can raise funds
1. Borrow from a Bank or Institution (Debt)
2. Issues shares to potential investors (Equity)
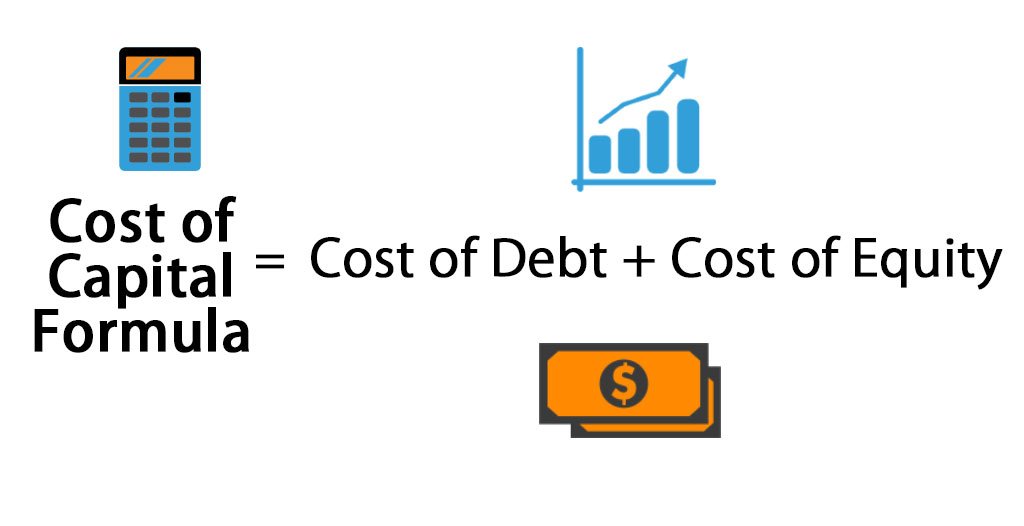
Each of these two avenues, require a cost.
For debt it is the interest rate at which the debt is issued.
For equity it is a combination of various risk specific required returns that investors expect from the company.
For debt it is the interest rate at which the debt is issued.
For equity it is a combination of various risk specific required returns that investors expect from the company.
We will explore how to calculate cost of debt and cost of equity along with required returns in another thread.
For now, just remember that 'r' in Dividend Discount Model stands for cost of capital which ultimately means costs of raising funds.
For now, just remember that 'r' in Dividend Discount Model stands for cost of capital which ultimately means costs of raising funds.
What is Growth Rate?
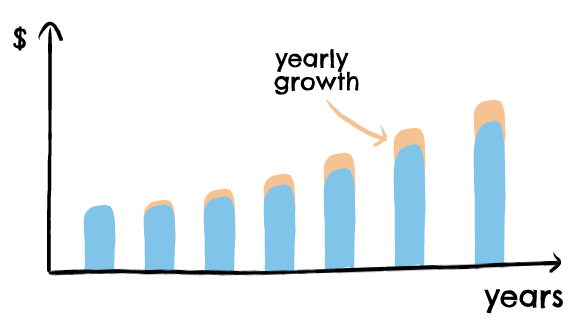
Growth Rate in the formula is referring to growth in profits of the company.
Its better to use a normalized growth rate, i.e., growth rate over a large time frame that includes period of both high and low growth.
Growth Rate in the formula is referring to growth in profits of the company.
Its better to use a normalized growth rate, i.e., growth rate over a large time frame that includes period of both high and low growth.
Now that you have a general idea of the formula, lets apply it to an example.
To demonstrate the Dividend Discount Model, I will be valuing #HeroMotoCorp to arrive at its intrinsic value. 

Let's find the relevant Hero Moto Corp data for our Dividend Discount Model formula.
Step 1: Find Dividend of the Company and Establish if Dividend Payout has a relation with Profitability
Hero Moto Corp has been paying out 70%+ of its yearly profits as dividends
Latest Dividend Payout was 71.9%
The latest 12 Month Dividend for the company was Rs 105 per share

Hero Moto Corp has been paying out 70%+ of its yearly profits as dividends
Latest Dividend Payout was 71.9%
The latest 12 Month Dividend for the company was Rs 105 per share


Step 2: Find Appropriate Growth Rate
Your Growth Rate needs to take a full cycle, i.e., both periods of normal and abnormal growth.
The Growth Rate should also be in line with your investment horizon, i.e., how long you want to invest for.
Your Growth Rate needs to take a full cycle, i.e., both periods of normal and abnormal growth.
The Growth Rate should also be in line with your investment horizon, i.e., how long you want to invest for.
Step 3: Find the cost of capital
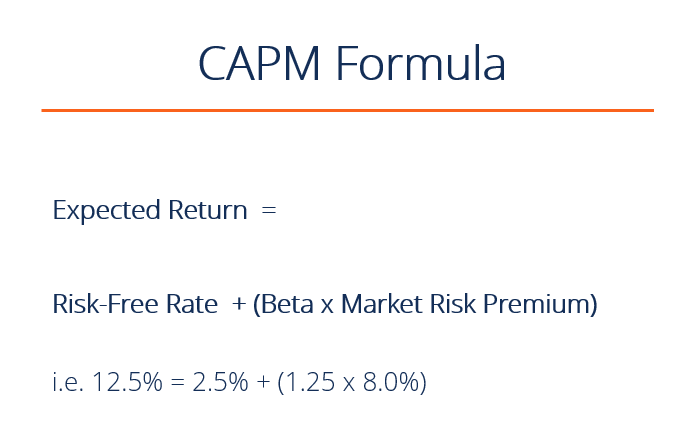
This is slightly complicated and there are other models like Capital Asset Pricing Model (CAPM) which help us determine the cost of equity for a company.
I will post another thread to explain CAPM in detail.
For now let's assume this to be 14%.
This is slightly complicated and there are other models like Capital Asset Pricing Model (CAPM) which help us determine the cost of equity for a company.
I will post another thread to explain CAPM in detail.
For now let's assume this to be 14%.
So, now we have all the components required for our Dividend Discount Model formula.
D = Rs 105 per share
g = 10%
r = 14%
g = 10%
r = 14%
As per the formula the intrinsic value of Hero Moto Corp today is Rs 2887.5 per share.
Now this is just an example, please don't consider this as real life use case.
The great part about this formula is that you can substitute the value in the formula and solve for 'g', i.e., the growth rate.
This method helps you find the implied growth rate that market is pricing in for the company.
This method helps you find the implied growth rate that market is pricing in for the company.
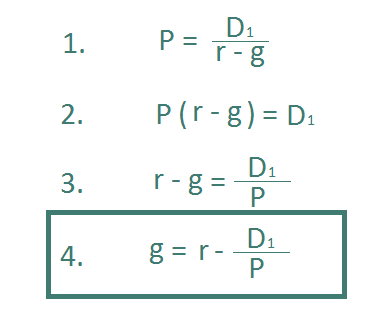
So that's how you use a Dividend Discount Model to value a company.
Like with everything in finance, there are lot of limitations to the model.
Before we end this thread, lets explore some of them.
Before we end this thread, lets explore some of them.

Limitation # 1
The model only works for companies that
1. Are paying a Dividend
2. Dividend has a clear linear relationship with profitability
The model only works for companies that
1. Are paying a Dividend
2. Dividend has a clear linear relationship with profitability
This model will not work for a company like MRF, that pays a steady dividend irrespective of whether the company makes a profit or loss in the year. 

Limitation # 2
The model doesn't incorporate any non linear growth factors of a company like
Optionalities (Hero moving into Electric Vehicles)
Increase in Margins
Market Structures
The model doesn't incorporate any non linear growth factors of a company like
Optionalities (Hero moving into Electric Vehicles)
Increase in Margins
Market Structures

Limitation # 3
Any change in assumption of 'r' and 'g' in the formula can sway the model and the intrinsic value can move by orders of magnitude.
So be very careful and conservative in your assumptions of 'r' and 'g'.
Any change in assumption of 'r' and 'g' in the formula can sway the model and the intrinsic value can move by orders of magnitude.
So be very careful and conservative in your assumptions of 'r' and 'g'.
This kind of model should work very well (at least in theory) for a company like ITC, which pays out 80% of its profits as dividends.
If you want to practice this, take example of ITC and post your valuation model in comments, I will be happy to retweet and provide feedback.
If you want to practice this, take example of ITC and post your valuation model in comments, I will be happy to retweet and provide feedback.

So that's how you use a Dividend Discount Model.
Its one of the easiest models to learn and understand the process of valuations.
Its one of the easiest models to learn and understand the process of valuations.
I hope, this thread helped you learn about Dividend Discount Models.
If you're new here, I write a thread every weekend, explaining an investing concept.
Here is a link to my last weekend's thread.
If you're new here, I write a thread every weekend, explaining an investing concept.
Here is a link to my last weekend's thread.
https://twitter.com/itsTarH/status/1434079035479314437?s=20
I also teach a few classes at @skillshare, sign up using any of the below links to get access to them along with 30,000+ classes on the Skillshare platform absolutely FREE for 30 days.
Class on Data Visualization
Get access to the class by using the below link
skl.sh/2XNug6A
Get access to the class by using the below link
skl.sh/2XNug6A
https://twitter.com/itsTarH/status/1427993843127906304?s=20
Class of Personal Finance
Get access to the class by using the below link
skl.sh/2Wjk7A7
Get access to the class by using the below link
skl.sh/2Wjk7A7
https://twitter.com/itsTarH/status/1419694448892514311?s=20
Also, write and publish long form articles on my @SubstackInc
Subscribe for FREE, if you're interested and join 3000+ readers that get insights on companies like Nykaa, PolicyBazaar, Renewables, etc. delivered straight to their inbox every few weeks.
investkaroindia.substack.com/p/nykaadeepdive
Subscribe for FREE, if you're interested and join 3000+ readers that get insights on companies like Nykaa, PolicyBazaar, Renewables, etc. delivered straight to their inbox every few weeks.
investkaroindia.substack.com/p/nykaadeepdive
If you find this thread useful then follow me
@itsTarH
I write a new thread every weekend.
All my previous work, can be found here.
@itsTarH
I write a new thread every weekend.
All my previous work, can be found here.
https://twitter.com/itsTarH/status/1401095938945425410?s=20
Thank you for reading!
See you next weekend with a brand new thread.
See you next weekend with a brand new thread.
• • •
Missing some Tweet in this thread? You can try to
force a refresh


