#MarsiliosTA
Hashtagging topic so easier to find during week if interested
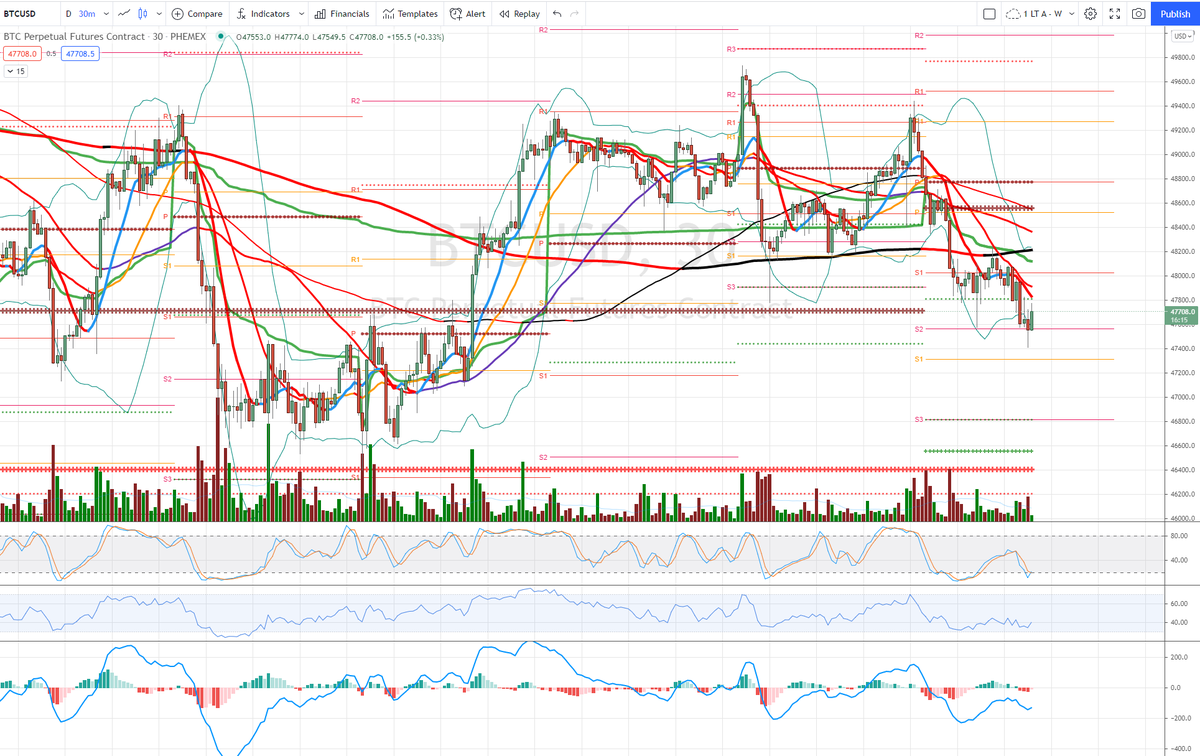
2 charts attached:
ARKK daily
BTC 30m
A lot going on - I can glance & absorb a lot of info
But starting out might look messy
Going to unpack, indicator by indicator
Hashtagging topic so easier to find during week if interested
2 charts attached:
ARKK daily
BTC 30m
A lot going on - I can glance & absorb a lot of info
But starting out might look messy
Going to unpack, indicator by indicator

#MarsiliosTA
The Yearly Pivot
I am giving away an amazing tool that not so many people know about, compared to say, daily 200 moving avg (D200MA) or 50MA, mentioned in CNBC all the time
Here's the same ARKK daily chart with only this on there
OK it was a great year for the YP
The Yearly Pivot
I am giving away an amazing tool that not so many people know about, compared to say, daily 200 moving avg (D200MA) or 50MA, mentioned in CNBC all the time
Here's the same ARKK daily chart with only this on there
OK it was a great year for the YP

But also GBTC and ETHE


And now look at DJI last year
Massive break early covid crash
And a couple of oops fakeouts
But from August, smart $ was betting on recovery
Cleared in August then held 2x
The reason I like this type of TA is that there is no opinion
Above level or not - no debate
Massive break early covid crash
And a couple of oops fakeouts
But from August, smart $ was betting on recovery
Cleared in August then held 2x
The reason I like this type of TA is that there is no opinion
Above level or not - no debate

#MarsiliosTA
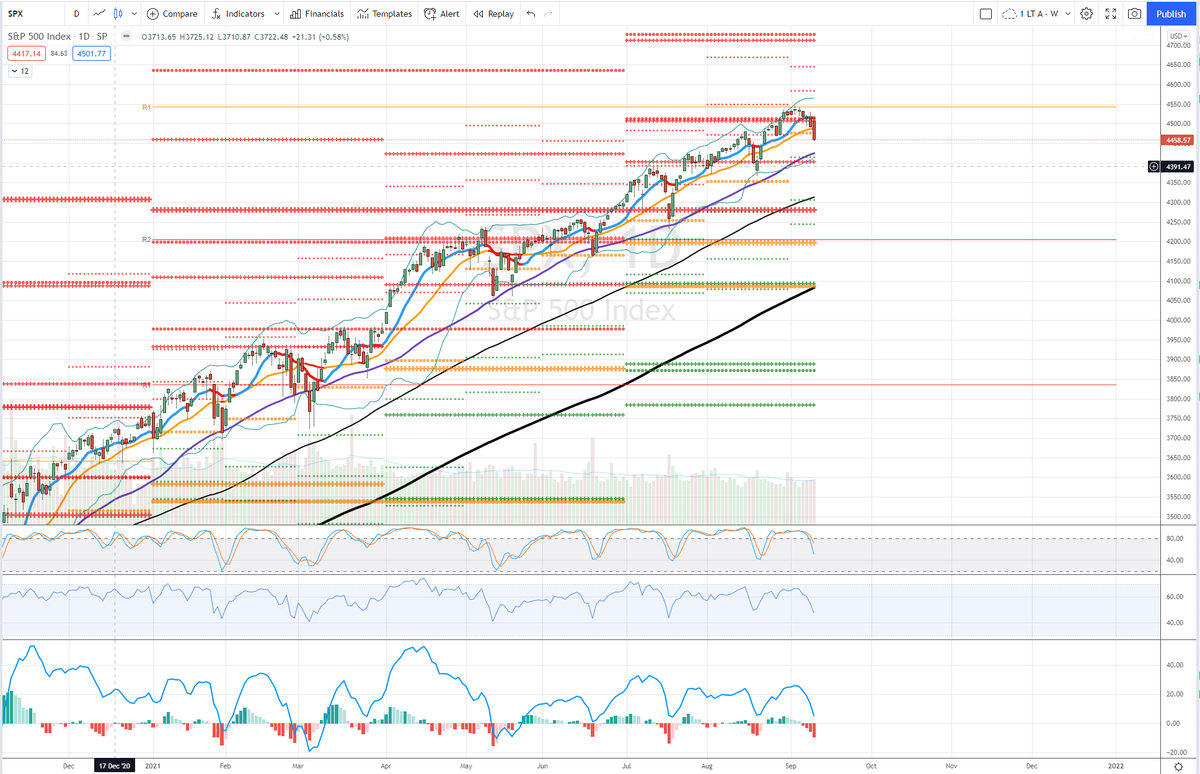
SPX even cleaner
3 holds late May - June 2020
Smart $ said bear market over, and that was the last touch of the SPX YP
Yes can be years between touches, depending on asset & market
SPX even cleaner
3 holds late May - June 2020
Smart $ said bear market over, and that was the last touch of the SPX YP
Yes can be years between touches, depending on asset & market

NDX
Of course NDX led - recovered early April 2020
This is an extreme market, but it isn't the first time that NDX YP hold or recovery has saved or restarted the bull trend
Of course NDX led - recovered early April 2020
This is an extreme market, but it isn't the first time that NDX YP hold or recovery has saved or restarted the bull trend

Here's NDX late 2018 low, and early 2019 YP recovery
1 day fractional break in late 2018 after big drop, that was 12/24
Next day 5%+
That was a massive low!
1 day fractional break in late 2018 after big drop, that was 12/24
Next day 5%+
That was a massive low!

#MarsiliosTA
Now that I have convinced you, what is the yearly pivot?
Pivot = (high + low + close of period) / 3
That's it! Just average of these 3. Period refers to whatever timeframe you are using.
yearly = last year so 2021 YP (yearly pivot) = (2020 H + L + C) / 3
Now that I have convinced you, what is the yearly pivot?
Pivot = (high + low + close of period) / 3
That's it! Just average of these 3. Period refers to whatever timeframe you are using.
yearly = last year so 2021 YP (yearly pivot) = (2020 H + L + C) / 3
I've also mentioned this in context of bear trend alert
Asset below YP probably not worth owning
2 examples, TLT & USO
That's the lesson for today, come back tomorrow to continue to build out these charts
(trying to hashtag each post but there will be thread & will unroll)
Asset below YP probably not worth owning
2 examples, TLT & USO
That's the lesson for today, come back tomorrow to continue to build out these charts
(trying to hashtag each post but there will be thread & will unroll)


unroll @threadreaderapp
• • •
Missing some Tweet in this thread? You can try to
force a refresh