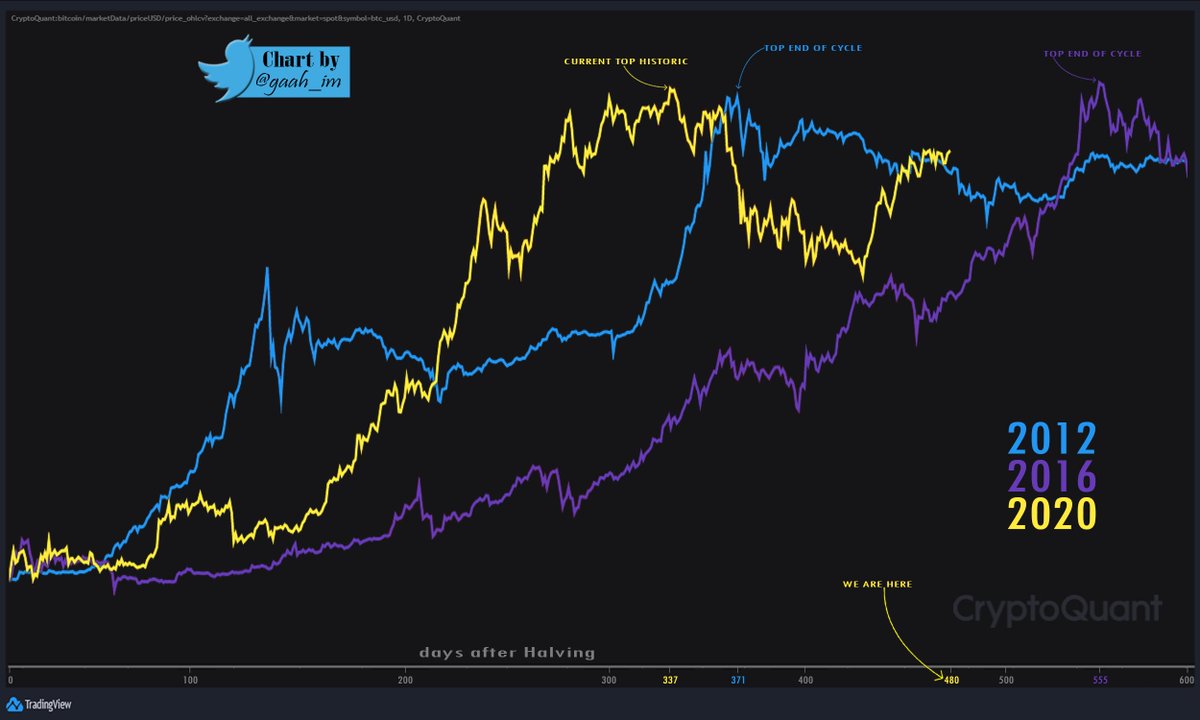
Time seems to tell about a new historical top! #Bitcoin
-Price starting from Halving:
Is it possible for this cycle to be the longest lasting?
It still has time if it repeats like 2016, as the previous cycle was longer compared to 2012.
Follow the Thread [6]👇👇
-Price starting from Halving:
Is it possible for this cycle to be the longest lasting?
It still has time if it repeats like 2016, as the previous cycle was longer compared to 2012.
Follow the Thread [6]👇👇

-Price from the breaking of the last ATH:
It is earlier than all cycles. The historical suggestion is that there is still enough time to make new corrections as well as new ATHs.
It is earlier than all cycles. The historical suggestion is that there is still enough time to make new corrections as well as new ATHs.

1/6 2011 occurred 4 corrections with an average duration of 80 days. These being between -40% to -55% depth. 

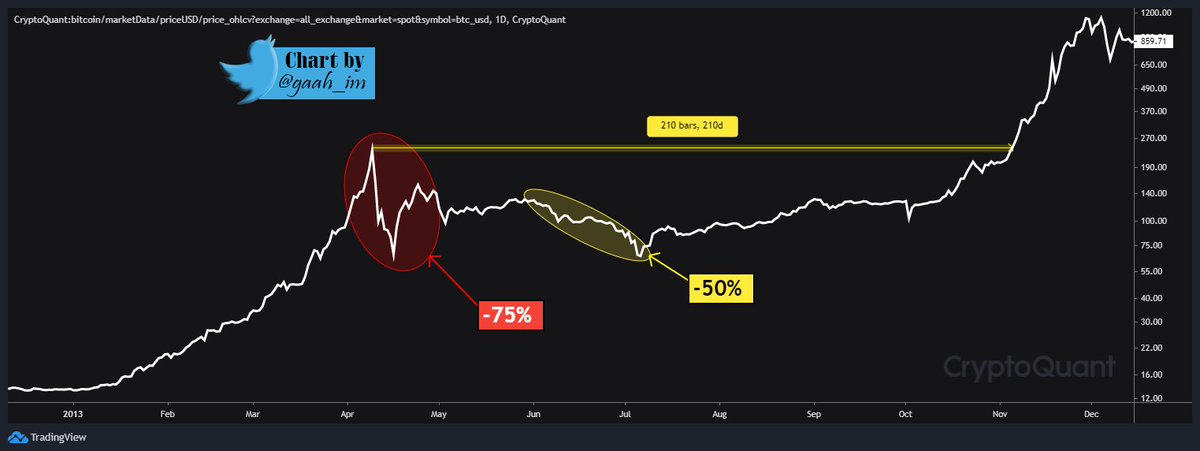
2/6 2013 only a single correction of -75% depth, it took about 210 days to resume the last top. After a brief price rebound after the big dip, in 36 days it fell -50%, from here on it only recovered high again. 

3/6 2017 occurred 3 price corrections, with an average duration of 35 days to resume the last top and trend continuation. The depth of the dips were between -30% to -40%. 

4/6 It already currently went through a correction earlier this year and is now going through a second one that we can only really confirm after breaking the last top ($65,000). The corrections are between -30% to -55% depth. 👇
It took about 30 days to recover the first retracement, while the correction that is still in effect is 140 days from the last top.
5/6 There is a brief resemblance to the first cycle, although the corrections were more aggressive and in greater numbers.👇
5/6 There is a brief resemblance to the first cycle, although the corrections were more aggressive and in greater numbers.👇

If this cycle gets even more similar to 2011 in the pattern of corrections, there are still 2 corrections to contend with, suggesting new ATH.
Still also equal in the corrective aspect in quantity compared to 2017, as retracements were less aggressive in terms of percentage.
Still also equal in the corrective aspect in quantity compared to 2017, as retracements were less aggressive in terms of percentage.
6/6 Looking from Halving, the top of 2011 and 2013 were faster, as 2017 took longer than all so far, this may be the case again. The current cycle is longer than all previous ones, including 2017.
The cycles are similar in the technical aspect and correction pattern.👇
The cycles are similar in the technical aspect and correction pattern.👇
The point is: The moments that occurred in the past have similarities to the present movements, the suggestion is that we still go higher!
See also at Quicktake:
cryptoquant.com/quicktake/6135…
-If you like my cycle analysis leave a RT/like🙌, Thanks ! Count on me🤜🤛😉
See also at Quicktake:
cryptoquant.com/quicktake/6135…
-If you like my cycle analysis leave a RT/like🙌, Thanks ! Count on me🤜🤛😉
• • •
Missing some Tweet in this thread? You can try to
force a refresh


