my unqualified bit on the 'overwhelmed' discussion

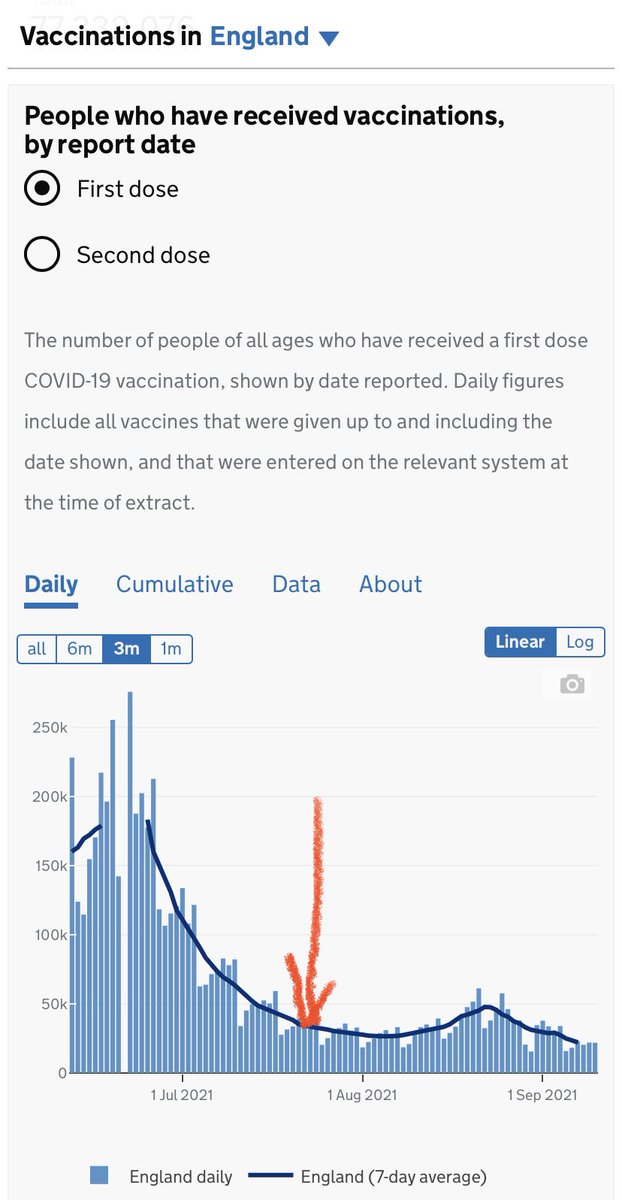
Think its complex & cant just put a number with respect to whole NHS, as if the virus was as simply spread neatly like below, since that's not how it works

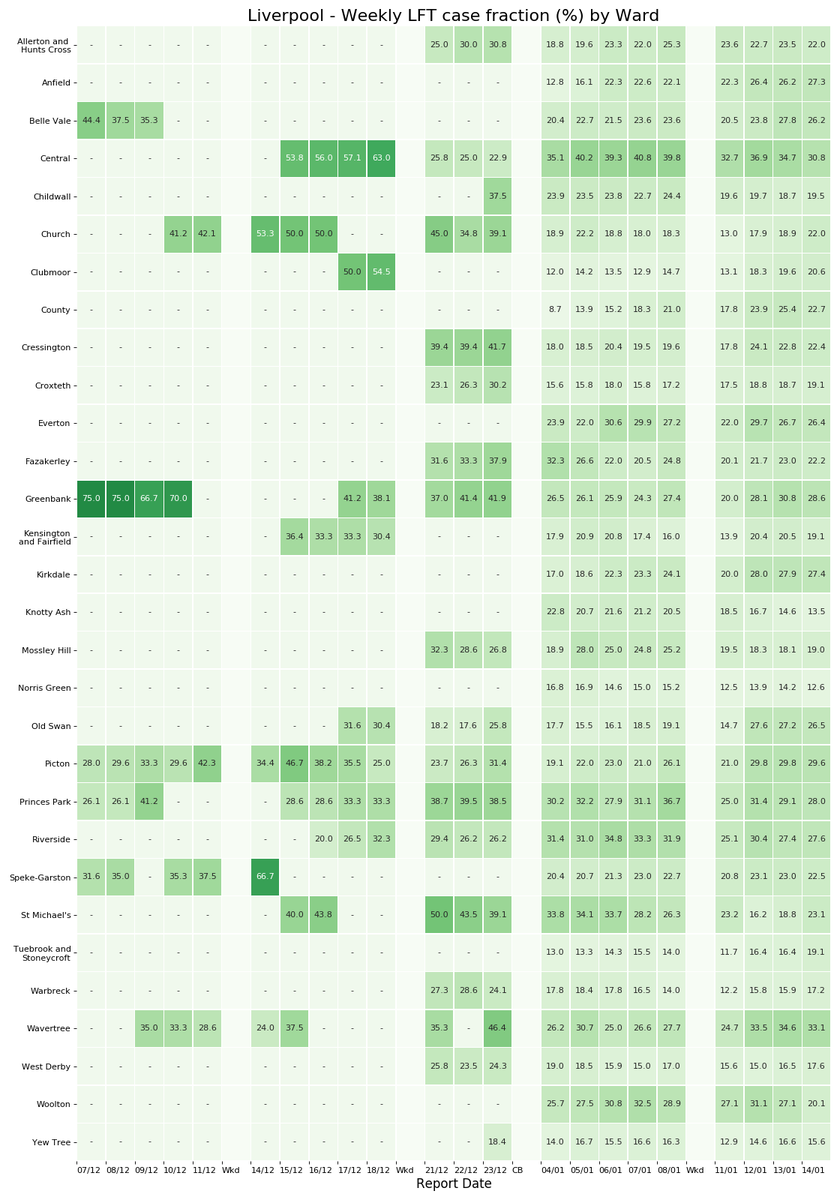
E.g Liverpool was swamped last autumn while London was relatively sound
Like, latest data up the 7th Sep 21 has Liverpool University Hospitals FT already over half the ICU beds of January peak, a time where make-shift beds had to be made cos of how overwhelmed the situation was <- during a lockdown that constrained other resp virus & accidents
Not my area, so don't know too much on this, but I wonder how much strain is also added to these services because of these other non-covid admissions to take into account, which 100% needs to be considered in this conversation obviously
One number for entire NHS is simple tbf & not suggesting having a number for each trust, gotta draw the line somewhere. But just saying, this complexity needs more discussion maybe as opposed to total NHS

Maybe a NHS regional discussion?
and hear from people who job it is to project medium term capacity issues at these trust/regional levels to come up with these thresholds , whoever they are, and go from there accordingly
Also before I get dm's again from KBF meffs or whatever... no, I don't think we should be properly considering shutting any business in a post-vaccine era

Just saying, need to discuss parameters defining actual limits better etc and follow from there 👍

/end

• • •

Missing some Tweet in this thread? You can try to force a refresh
 

Keep Current with Adam Ruby

Adam Ruby Profile picture

Stay in touch and get notified when new unrolls are available from this author!

Read all threads

This Thread may be Removed Anytime!

PDF

Twitter may remove this content at anytime! Save it as PDF for later use!

Try unrolling a thread yourself!

how to unroll video
  1. Follow @ThreadReaderApp to mention us!

  2. From a Twitter thread mention us with a keyword "unroll"
@threadreaderapp unroll

Practice here first or read more on our help page!

More from @AdamJRuby

13 Sep
Weekly #COVID19 thread for Liverpool: 13th Sep 21
• Cases up on last week: 380.7 per 100k pop (361.8 week ago)
• Hospital admissions up 🏥
• 10 recorded deaths for week ending 27th Aug (ONS)
• Vaccination 1st dose up 0.2%, 2nd doses up 0.9% of eligible pop💉

1/
The weekly case rate per 100k pop is 380.7, up slightly from 361.8 last week.

In the same time though there has been a bump in cases. Hopefully remains a bump (there was lots of back-to-school testing)

Data by specimen date up to 9th Sept

2/
Rolling weekly case rates per 100k for under and over 60's.

Under 60 rates are higher than over 60's.

sharp spike in under 60's but may have turned. Over 60's also went up. Due to change in testing strategy unclear to call what this change in trend means fully.

3/
Read 26 tweets
12 Sep
Pretty obvious considering how little seemed done in terms of specifics / actually sorting it out

Was always just a lie to try & nudge unvaccinated to take it up… did it work?
not sure it actually did much

No signal in increasing uptake after the original announcement, or after any other half-hearted stints ministers had on TV/radio Image
Would vaccine passports reduce transmission in higher risk settings? …Yeah think current science backs that (below)

Should the UK have implemented them? …Difficult q imo, given relatively high uptake already, moral arguments aside is it cost effective/make much diff ?
Read 7 tweets
15 Jan
Weekly update on the #COVID19 situation in Liverpool: 15th Jan 2021

- Weekly cases possibly peak on 8th Jan at 5,419.
- Both under & over 60's rate starting to fall. 🙂
- BUT, Liverpool hospitals admissions have increased sharply, passing highest levels from 2nd wave 😩

1/19
Total weekly cases were seen to grow >3x that of previous week at end of year but weekly growth has now declined & cases are now falling.

The peak occurred 8th Jan but more importantly cases are still higher than in 2nd wave, so restrictions still necessary. 2/19
Scary rates were seen for both under & over 60 age groups at end of year but both have started to show signs of discontinued growth.

Still, rates in > 60's are very high and unfortunately lots more people will require hospital treatment. 3/19
Read 21 tweets
15 Jan
Liverpool #COVID19 Community Testing: 14th Jan 2021 update

The pilot is over but Liverpool are still rolling out lateral flow tests in some form or another. Here's the weekly breakdown from 7th Dec.

CB = Christmas Break

Data: liverpool.gov.uk/communities-an… 1/5
Weekly LFT fraction of +ves, for those areas not affected by small number suppression:

No more low numbers so can see the fractions in all areas now

33% of Wavertree's cases were identified by asymptomatic testing last week. Mean of 23% across all areas 2/5
After Liverpool was placed in Tier 2 following the 2nd National Lockdown cases started to edge up. Though, the jump in the week following Christmas towered over this..

However, currently there are small signs cases could be starting to decrease! 🤞

3/5
Read 5 tweets
13 Jan
Liverpool #COVID19 Community Testing: 13th Jan 2021 update

The pilot is over but Liverpool are still rolling out lateral flow tests in some form or another. Here's the weekly breakdown from 7th Dec.

CB = Christmas Break

Data: liverpool.gov.uk/communities-an… 1/5 Image
Weekly LFT fraction of +ves, for those areas not affected by small number suppression:

No more low numbers so can see the fractions in all areas now

35% of Central Liverpool's cases were identified by asymptomatic testing last week. Mean of 23% across all areas 2/5 Image
After Liverpool was placed in Tier 2 following the 2nd National Lockdown cases started to edge up. Though, the jump in the week following Christmas towered over this..

However, currently there are small signs cases could be starting to decrease. Still high but we'll see!🤞

3/5 Image
Read 5 tweets
12 Jan
Liverpool #COVID19 Community Testing: 12th Jan 2021 update

The pilot is over but Liverpool are still rolling out lateral flow tests in some form or another. Here's the weekly breakdown from 7th Dec.

CB = Christmas Break

Data: liverpool.gov.uk/communities-an… 1/5 Image
Weekly LFT fraction of +ves, for those areas not affected by small number suppression:

No more low numbers so can see the fractions in all areas now

37% of central Liverpool's cases were identified by asymptomatic testing last week. Mean of 23% across all areas 2/3 Image
After Liverpool was placed in Tier 2 following the 2nd National Lockdown cases started to edge up. Though, the jump in the week following Christmas towered this rise..

However, currently there are small signs cases could be starting to decrease. We'll see!

3/5 Image
Read 5 tweets

Did Thread Reader help you today?

Support us! We are indie developers!


This site is made by just two indie developers on a laptop doing marketing, support and development! Read more about the story.

Become a Premium Member ($3/month or $30/year) and get exclusive features!

Become Premium

Too expensive? Make a small donation by buying us coffee ($5) or help with server cost ($10)

Donate via Paypal Become our Patreon

Thank you for your support!

Follow Us on Twitter!

:(