Weekly #COVID19 thread for Liverpool: 13th Sep 21
• Cases up on last week: 380.7 per 100k pop (361.8 week ago)
• Hospital admissions up 🏥
• 10 recorded deaths for week ending 27th Aug (ONS)
• Vaccination 1st dose up 0.2%, 2nd doses up 0.9% of eligible pop💉
1/
• Cases up on last week: 380.7 per 100k pop (361.8 week ago)
• Hospital admissions up 🏥
• 10 recorded deaths for week ending 27th Aug (ONS)
• Vaccination 1st dose up 0.2%, 2nd doses up 0.9% of eligible pop💉
1/

The weekly case rate per 100k pop is 380.7, up slightly from 361.8 last week.
In the same time though there has been a bump in cases. Hopefully remains a bump (there was lots of back-to-school testing)
Data by specimen date up to 9th Sept
2/
In the same time though there has been a bump in cases. Hopefully remains a bump (there was lots of back-to-school testing)
Data by specimen date up to 9th Sept
2/

Rolling weekly case rates per 100k for under and over 60's.
Under 60 rates are higher than over 60's.
sharp spike in under 60's but may have turned. Over 60's also went up. Due to change in testing strategy unclear to call what this change in trend means fully.
3/
Under 60 rates are higher than over 60's.
sharp spike in under 60's but may have turned. Over 60's also went up. Due to change in testing strategy unclear to call what this change in trend means fully.
3/

Latest reported figures for admissions into Liverpool University Hospitals NHS FT up to 5th Sep.
Avg number of patients admitted to hospital each day is 18.9 (14.1 per day last week).
Num of patients in hospital is up from 168 reported last week to 178.
20 in ICU (17 lw)
4/
Avg number of patients admitted to hospital each day is 18.9 (14.1 per day last week).
Num of patients in hospital is up from 168 reported last week to 178.
20 in ICU (17 lw)
4/

By occurrence, the provisional number of people with COVID-19 on their death certificates in Liverpool for the week ending 27th Aug was 9 (10 in week prior)
Below is a plot showing the 914 deaths in Liverpool since 4th Sept 2020, i.e incl the 2nd & 3rd waves
5/
Below is a plot showing the 914 deaths in Liverpool since 4th Sept 2020, i.e incl the 2nd & 3rd waves
5/

Of the 71 so far reported total deaths in Liverpool week ending 27th Aug, 9 (13%) were due to COVID-19.
Excess deaths was ~4% above the 5-year non-pandemic average for that week.
6/
Excess deaths was ~4% above the 5-year non-pandemic average for that week.
6/
Below is the rolling weekly case rates in Liverpool for age groups in phase 1 of JCVI vaccination priority list.
Note how the log plot breaks down at low numbers...
7/
Note how the log plot breaks down at low numbers...
7/

same thing on a linear scale
8/
8/

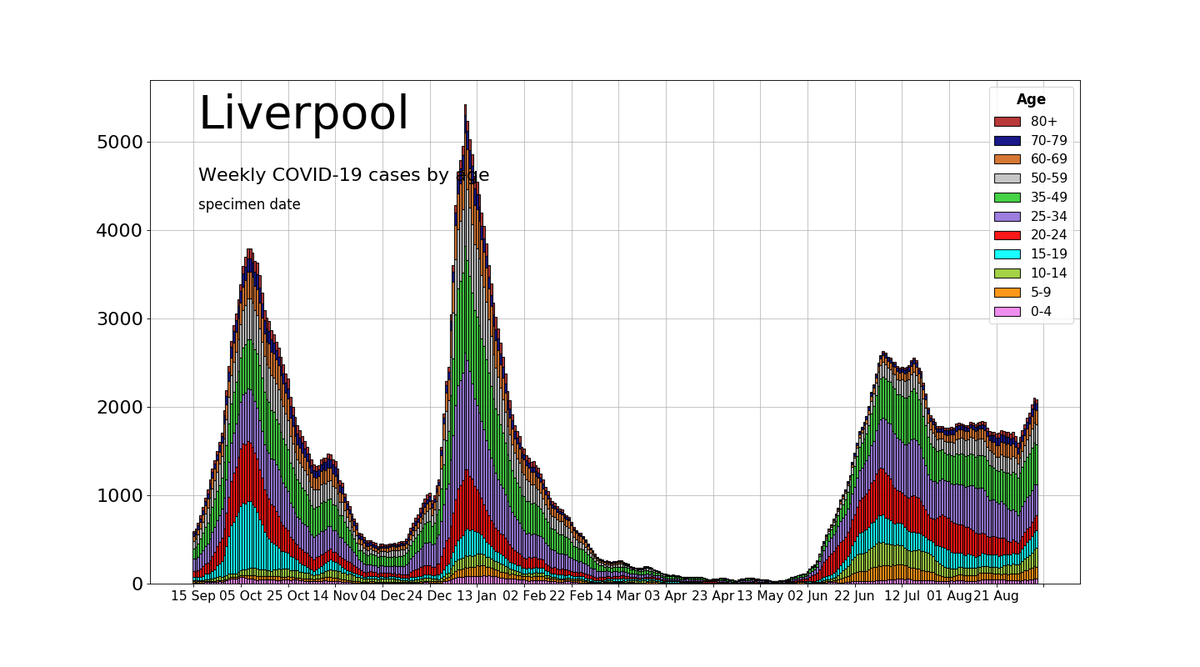
Can break weekly cases down by age to see which age groups contribute to total cases.
When case numbers were small this stacked plot becomes less useful.
9/
When case numbers were small this stacked plot becomes less useful.
9/
Normalising the above to 100% can show trends more clearly.
Just under ~50% of cases in Liverpool in previous reported week are from people under the age of 35.
Note how older groups are now eating up more of the space, as per the age plots above
10/
Just under ~50% of cases in Liverpool in previous reported week are from people under the age of 35.
Note how older groups are now eating up more of the space, as per the age plots above
10/

Thanks to Liv Uni team, been kindly given access to some CIPHA data to fix my PCR/LF plots.
Up to 8th Sep, CIPHA reported 2329 cases (1860 last week). This includes 458 individuals (20%) identified by lateral flow testing.
11/
Up to 8th Sep, CIPHA reported 2329 cases (1860 last week). This includes 458 individuals (20%) identified by lateral flow testing.
11/

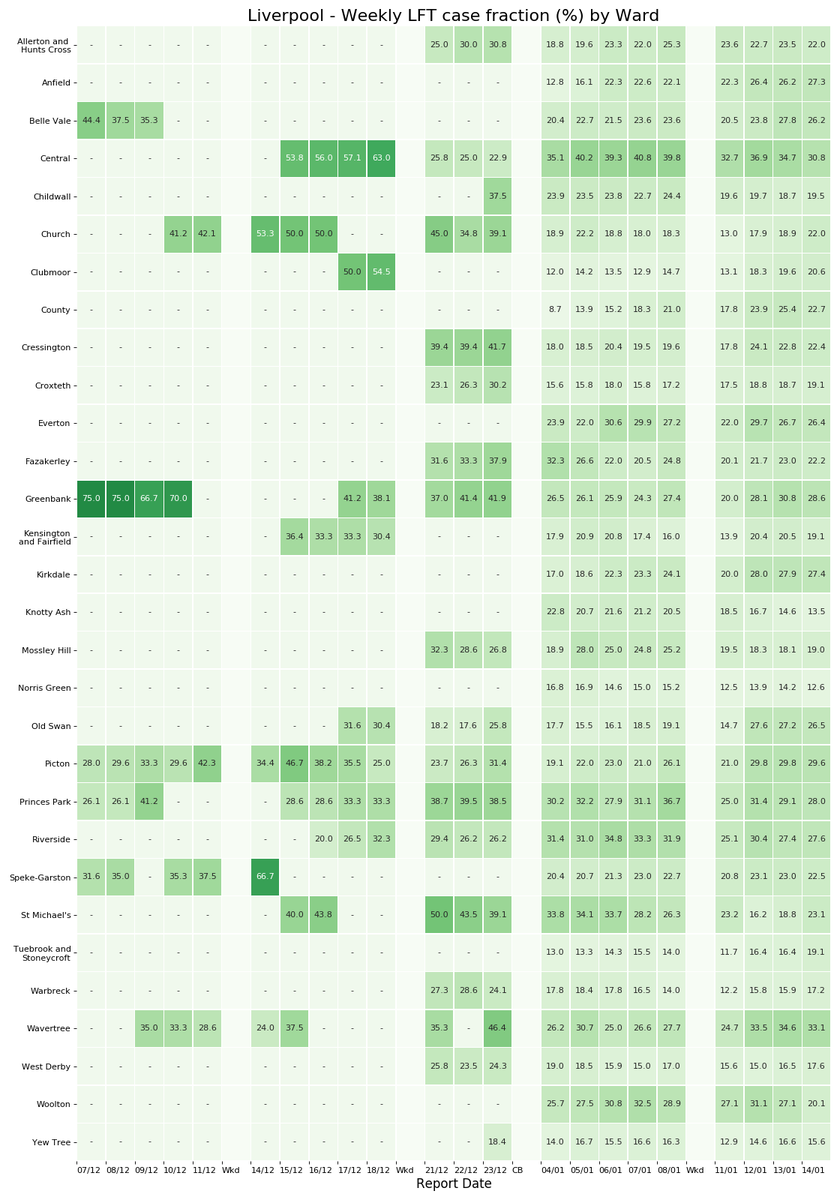
Below is a breakdown of how many weekly tests are actually conducted split by symptomatic PCR & asymptomatic lateral flow testing.
Most recent positivity:
PCR 10.6% (9.4% last week)
Lateral flow* 1.23% (1.73% last week)
12/
Most recent positivity:
PCR 10.6% (9.4% last week)
Lateral flow* 1.23% (1.73% last week)
12/

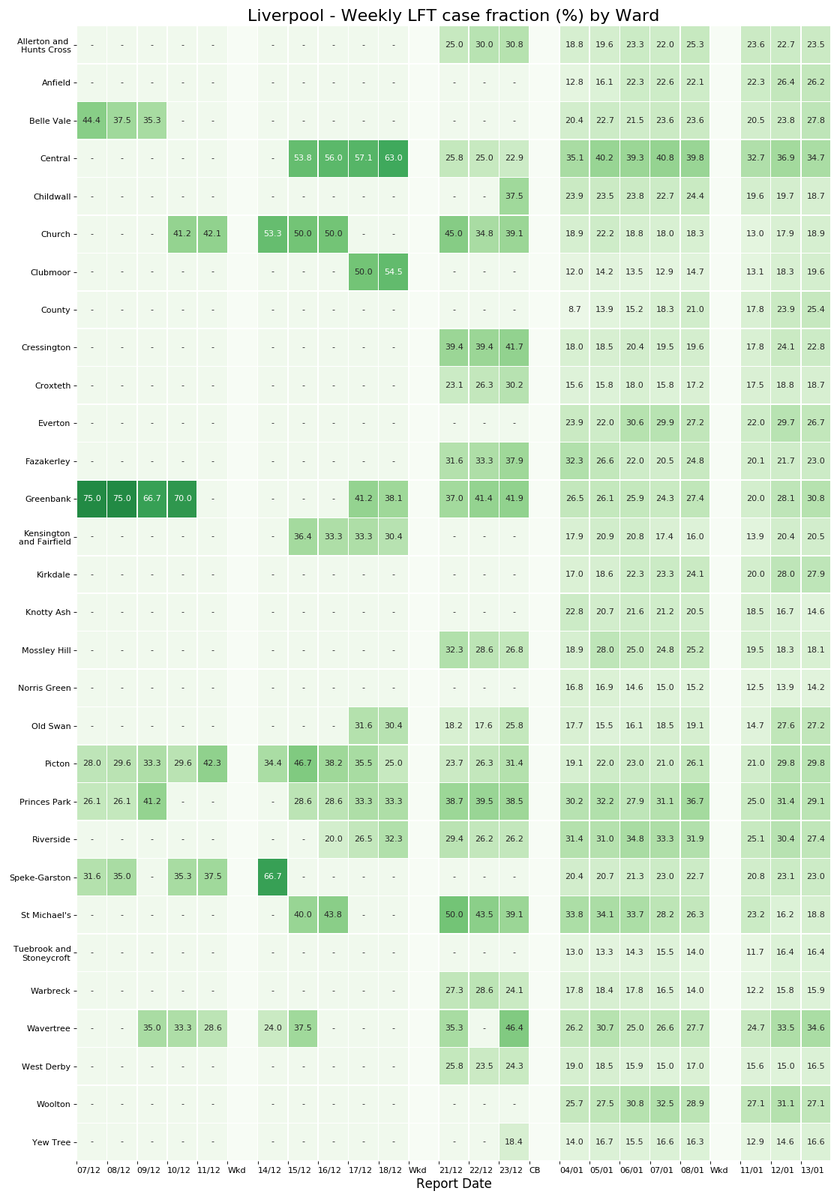
Note: CIPHA cases don't include Pillar 1 & also don't seem to match the total rolling weekly cases reported by the dashboard for Liverpool.
I looked to see if cases flagged 'confirmatory PCR' were the discrepancy but guess not.
Still, useful to see LF/PCR breakdown shapes
13/
I looked to see if cases flagged 'confirmatory PCR' were the discrepancy but guess not.
Still, useful to see LF/PCR breakdown shapes
13/

If we zoom out, the point of highest weekly symptomatic PCR positivity of the third wave surpassed the highest point in the second wave.
Note the surge testing venture just after 6th November + events trial testing start of May.
14/
Note the surge testing venture just after 6th November + events trial testing start of May.
14/

According to Apple routing data, Liverpool's recent driving levels (red) suggest that levels have moved past pre-pandemic mid-Jan 2020 levels.
Liverpool are below England's average and moved up rapidly since start of July and now turning back down.
15/
Liverpool are below England's average and moved up rapidly since start of July and now turning back down.
15/

Zooming out, one can compare driving levels via this metric to other previous lockdown time periods.
16/
16/

A quick look at rolling weekly case rates across the Liverpool City Region.
All areas turned after reaching similar cases per 100k. All areas currently floating about the same rate with some moving up of recent (but maybe a bump?)
Log plot
17/
All areas turned after reaching similar cases per 100k. All areas currently floating about the same rate with some moving up of recent (but maybe a bump?)
Log plot
17/

Same thing on a linear plot.
Ratio plot for LCC having bars being red implies cases have grown from the previous week
18/
Ratio plot for LCC having bars being red implies cases have grown from the previous week
18/

ONS random infection survey report the West Lancashire area (Liverpool/Knowsley/Sefton) have a prevalence of ~1.31% (CI 1.01-1.68) for week ending 3rd Sept
up, but within CI's, from ~1.19% (CI 0.73-1.90) in week before
ons.gov.uk/peoplepopulati…
19/
up, but within CI's, from ~1.19% (CI 0.73-1.90) in week before
ons.gov.uk/peoplepopulati…
19/

Delta variant Liverpool update from Sangers website: covid19.sanger.ac.uk/lineages/raw
Delta accounting for ~100% of cases in Liverpool and latest graphics shown below
20/
Delta accounting for ~100% of cases in Liverpool and latest graphics shown below
20/

Previous update thread from last week
21/
21/
https://twitter.com/AdamJRuby/status/1434976752305115137?s=20
Sources
Case/Hospital data:
GOV ( coronavirus.data.gov.uk )
Liverpool city council: liverpool.gov.uk/communities-an…
Deaths data: ons.gov.uk/peoplepopulati…
Apple mobility trends: covid19.apple.com/mobility
22/
Case/Hospital data:
GOV ( coronavirus.data.gov.uk )
Liverpool city council: liverpool.gov.uk/communities-an…
Deaths data: ons.gov.uk/peoplepopulati…
Apple mobility trends: covid19.apple.com/mobility
22/
Caveats:
- Hospital data released every Thursday
- Only for Liverpool University Hospitals NHS Foundation Trust (other Liverpool Trusts have small numbers)
- Five year Avg deaths scaled from national proportion (ONS definition)
23/
- Hospital data released every Thursday
- Only for Liverpool University Hospitals NHS Foundation Trust (other Liverpool Trusts have small numbers)
- Five year Avg deaths scaled from national proportion (ONS definition)
23/
Summary (I)
1,896 cases in last week of data in Liverpool, up on last week. Positivity up a bit but still at ~10% (PCR), like throughout August.
Hospital admissions went up, latest data at ~19 people admitted per day. Beds & ICU still going up
24/
1,896 cases in last week of data in Liverpool, up on last week. Positivity up a bit but still at ~10% (PCR), like throughout August.
Hospital admissions went up, latest data at ~19 people admitted per day. Beds & ICU still going up
24/
Summary (II)
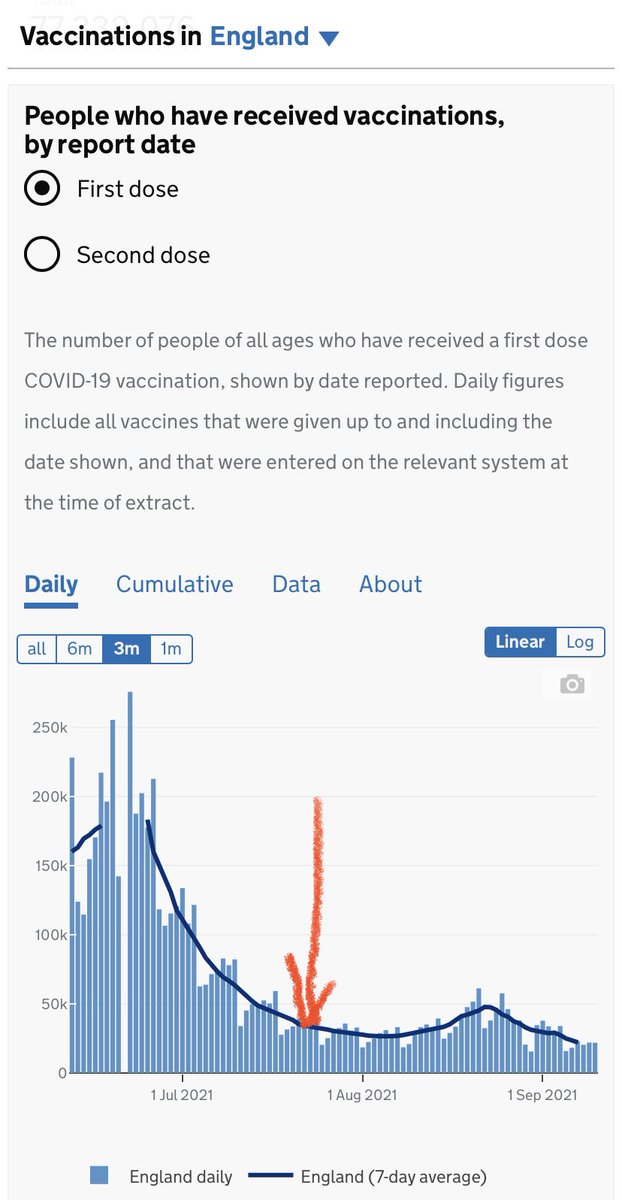
Liverpool new 1st dose vaccinations only up slightly; city behind England average for vaccinations.
List of local drop-in vaccination sites below for those still considering: liverpoolccg.nhs.uk/health-and-ser…
25/25
Liverpool new 1st dose vaccinations only up slightly; city behind England average for vaccinations.
List of local drop-in vaccination sites below for those still considering: liverpoolccg.nhs.uk/health-and-ser…
25/25
@threadreaderapp unroll
• • •
Missing some Tweet in this thread? You can try to
force a refresh