Updating for 3rd wk Sept. Slightly delayed due to delayed data update on PIB/MoHFW.
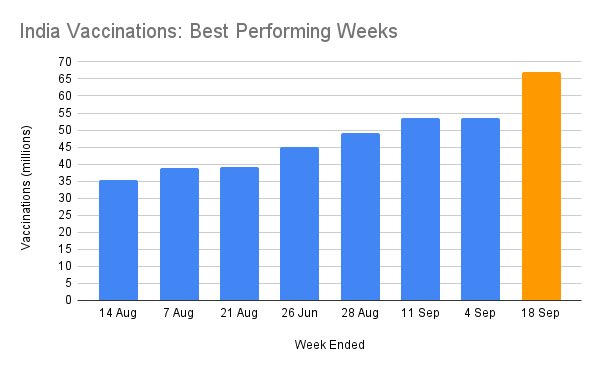
Predictably after the 25M world record on Sept 17, this week is the best ever- 67 million.
This week alone is 2x the total by Europe or North America for the whole September to date.
1/
Predictably after the 25M world record on Sept 17, this week is the best ever- 67 million.
This week alone is 2x the total by Europe or North America for the whole September to date.
1/
https://twitter.com/surajbrf/status/1436738377240383489
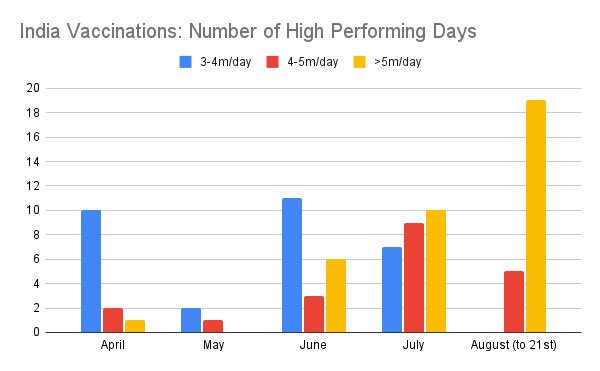
The daily bucketed performance is unable to show the magnitude of the Sept 17th perf well enough. A simpler expression is:
1. On Sept 17, India did more doses than the rest of the world combined.
3. India accounted for ~60% of doses worldwide that day.
2/
1. On Sept 17, India did more doses than the rest of the world combined.
3. India accounted for ~60% of doses worldwide that day.
2/

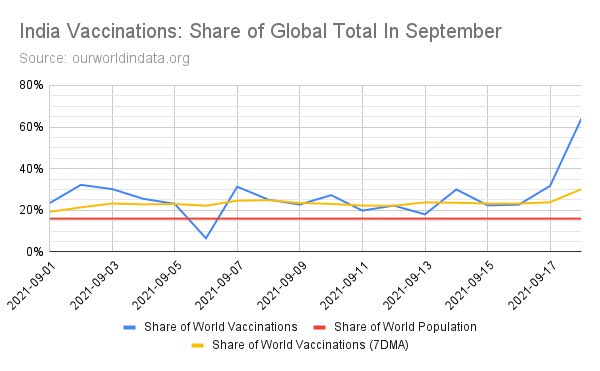
The following two charts show Indian vaccination as a fraction of global total in September, both daily and aggregate.
India has outdone its share of world pop (~16%) substantially. When share crosses 50%, that means India outdoes rest of world combined.
3/
India has outdone its share of world pop (~16%) substantially. When share crosses 50%, that means India outdoes rest of world combined.
3/

Month to date vaccinations are nearly 155 million now, more than any month except August, which it is on track to overtake this week.
The current 18 day performance extrapolates to a month end total of 250-260 million doses.
4/
The current 18 day performance extrapolates to a month end total of 250-260 million doses.
4/

Last week, Indian vaccinations were compared to cumulative performance in multiple continents.
India continues to maintain a performance totaling higher than the combined vaccinations in Europe + N America + S America + Africa.
5/
India continues to maintain a performance totaling higher than the combined vaccinations in Europe + N America + S America + Africa.
5/

An argument made recently is that govt is hoarding supplies for one-day PR stunts.
Data does not agree. It instead matches what’s stated before - supplies available with states closely tracks prior 1-week performance.
Trendlines align, with no supply accumulation.
6/
Data does not agree. It instead matches what’s stated before - supplies available with states closely tracks prior 1-week performance.
Trendlines align, with no supply accumulation.
6/

The previous chart is simply 7DMA data overlaid with this previously reported chart.
Tl;dr - the inventories with states equal approx a 1wk supply, and this has not changed for many weeks.
Not very different from business; 1wk supply lets system work smoothly…
7/
Tl;dr - the inventories with states equal approx a 1wk supply, and this has not changed for many weeks.
Not very different from business; 1wk supply lets system work smoothly…
7/

India officially overtook Europe this week in total doses.
A close race which became a no contest on the 17th, when India started the day a few million behind and finished it >20 million ahead.
Note: ourworldindata has a 1-2 day lag in Indian data.
8/
A close race which became a no contest on the 17th, when India started the day a few million behind and finished it >20 million ahead.
Note: ourworldindata has a 1-2 day lag in Indian data.
8/

The same data lag applies to this chart, but nevertheless it emphasizes the gulf between India and rest of world now.
Both in raw 7DMA and in daily vaccinations/100, India continues to do far better than the western world.
Thanks to Brazil, S America is also doing well.
9/
Both in raw 7DMA and in daily vaccinations/100, India continues to do far better than the western world.
Thanks to Brazil, S America is also doing well.
9/


This week, India reached:
* 800 million total doses
* 600 million with 1 dose
* 200 million fully vaccinated
It took 11 days to get from 700m to 800m. Therefore ending the month on >900m remains on track.
The key now is to reduce 2nd dose interval to finish faster.
10/10
* 800 million total doses
* 600 million with 1 dose
* 200 million fully vaccinated
It took 11 days to get from 700m to 800m. Therefore ending the month on >900m remains on track.
The key now is to reduce 2nd dose interval to finish faster.
10/10

• • •
Missing some Tweet in this thread? You can try to
force a refresh