1. Due to the Macro environment in the chain and the cyclical moment that #Bitcoin is in, I am leaving the more aggressive Risk Management in the Private Fund (BANCA2) that I manage.
2. Today we have positions in over 10 different crypto-actives, including the largest position in #Bitcoin .
The targets set are according to the expansions of my operating model, so they will only be hit when the market wants them.
3. First target in 2 #Bitcoin operations were reached around $51,000 - $52,000
Still the Private Investment Fund has 45-50% of the dollar cash available for operational, plus that cash will go up if it needs it, as there is more liquidity in the Fund for this next leg up.
4. See that risk management in this market is more important than the technique itself. In a high volatility environment you should NEVER be 100% out or 100% exposed, but rather calibrate exposure according to cyclical momentum.
5. When #Bitcoin was being priced in April/May around $50k-$60k our exposure was 15-20%. After dropping levels down to $30,000 our exposure more than doubled, we literally bought the entire dip in various assets, including #BTC .
6. Now, time is on our side and we have the power to play at least 15-20% more liquidity in the market and increase positions.
7. On-chain analysis determines the direction of the market, not the up/down moves that will always occur. The focus should be on direction, so EVERY dip that comes along the way is a new opportunity to increase the position, as in our case!
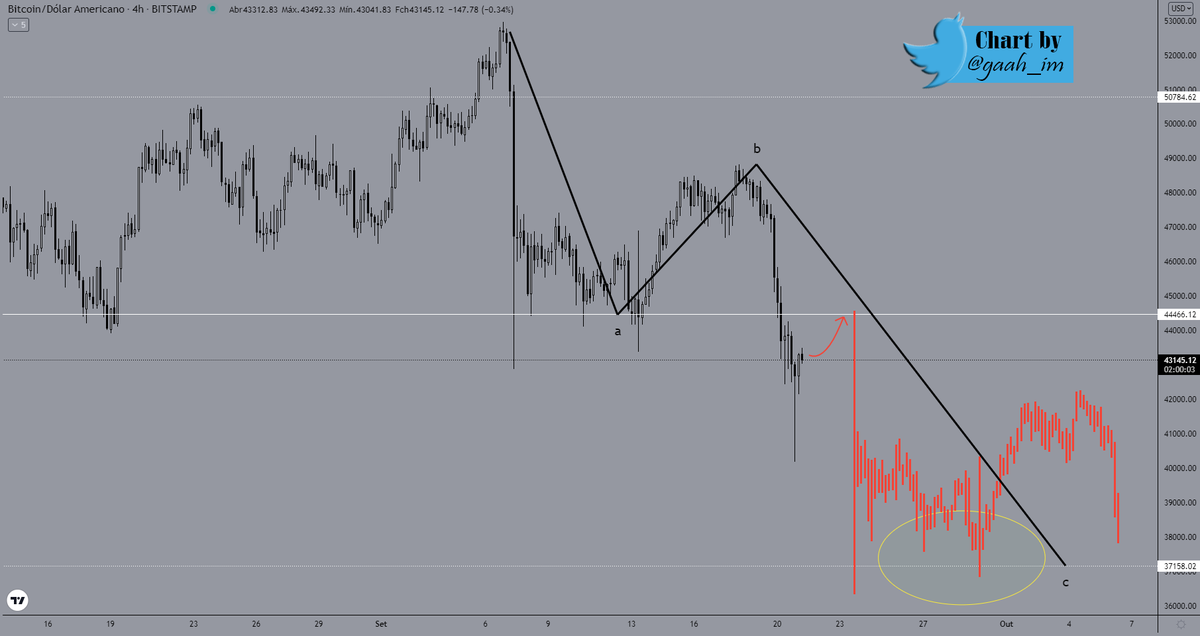
8. There are odds #Bitcoin will test $37k (stealth point of the rebound) and should this happen, that is the level where most of the available liquidity will be consumed. If the market is not going to test it is no problem, ...👇
as we are also exposing ourselves at this current support region and $37,000 has already been part of our buying.
- Focus on direction so that in the short term you know what to do with volatility. 🙌🤜🤛
• • •
Missing some Tweet in this thread? You can try to
force a refresh
The ratio MVRV is defined as the market capitalization of an asset divided by the realized capitalization. With this indicator it is possible to map the behavior in previous cycles and define the revenue of the current moment.
Thread👇👇
1. Ranking the phases of the cycles in sequence of 1-3 starting with NUMBER 1 after the start of the bull market and the top meeting in the middle of the bullish cycle.
2. There is a historical moment in the middle of the bull run, where it always looks like the end of the valuation, however it is just a short-term top in the middle of the bullish run. By hitting that top and offering the best buying moment within the bull market, 👇
3.5 channel breaks in 2013, reversal requires 4 total channel breaks, totaling 1 entire sub-cycle.
2.5 channel breaks in the correction we are currently in, much softer than 2013 even retracing -55% since the last top.
After testing in the Neutral Zone, retracement to the stealth point (50% of the REFERENCE CHANNEL) historically occurs.
This point is important as it is where market sentiment turned, as well as being the daily close of the first dip and also the bar close of the Monthly chart.
Breaking through sets up a new full move and hits $37k, at the stealth point of the price rebound.
It has only walked 0.5 of the move (the discount at 50% and at the PIVOT). This moment is crucial for the Bulls to advance above $44,400 and have a daily close.
If this does not happen, the full move must be completed.
The quick turn around after the dip to $40k has a high probability of being Short positions.
Interest at this time in opening short positions should increase as sentiment is in fear and speculators take advantage.
1. The number of transactions occurring on the #Bitcoin network still below the yellow average, signals little movement on the chain. If this number stays above the yellow average indicates new dormant participants moving in, volatility in the price is expected.
2. Already the average number of tokens transferred on the network points to another new top, followed by 3 tops in sequence since trapping at major support. The latest record points to an average of 42.15 #BTC transferred per transaction.
3. Long-time participants in the chain continue to move, the high volume and low frequency on the network indicate that short-term holders are staying out of the market.
1/5 Miners back accumulate from the correction to the support at $30,000, there were miners selling during the correction, but only to supplement cash as there was the ban in China and then they had to relocate to a different location.
Thread👇👇
I recently posted the pattern identified in the MPI, which shows when miners sell.
2/5 The Reserves show the time when they offered to sell, around $25,000 to $30,000 right at the beginning of the year.👇
1/5 SCA in record after record, HODLERS never stopped buying, they are accumulating more than ever.
Long-term holders aged 2-3 years and 12-18 months continue to accumulate strongly, as reflected in the SCA.
Follow the Thread👇👇
2/5 This indicator is the value of the sum of unspent coins, transaction output in live days, and their value.
Since testing support at $30,000 these guys have flipped their hand to buy.
3/5 We should keep an eye on holders aged 3-6 and 6-12 months, as @DanielJoe916 mapped out recently and made this part clear, they have absorbed practically all liquidity from the correction with long term holders.