The best time to buy #Bitcoin is now!
The ratio MVRV is defined as the market capitalization of an asset divided by the realized capitalization. With this indicator it is possible to map the behavior in previous cycles and define the revenue of the current moment.
Thread👇👇
The ratio MVRV is defined as the market capitalization of an asset divided by the realized capitalization. With this indicator it is possible to map the behavior in previous cycles and define the revenue of the current moment.
Thread👇👇

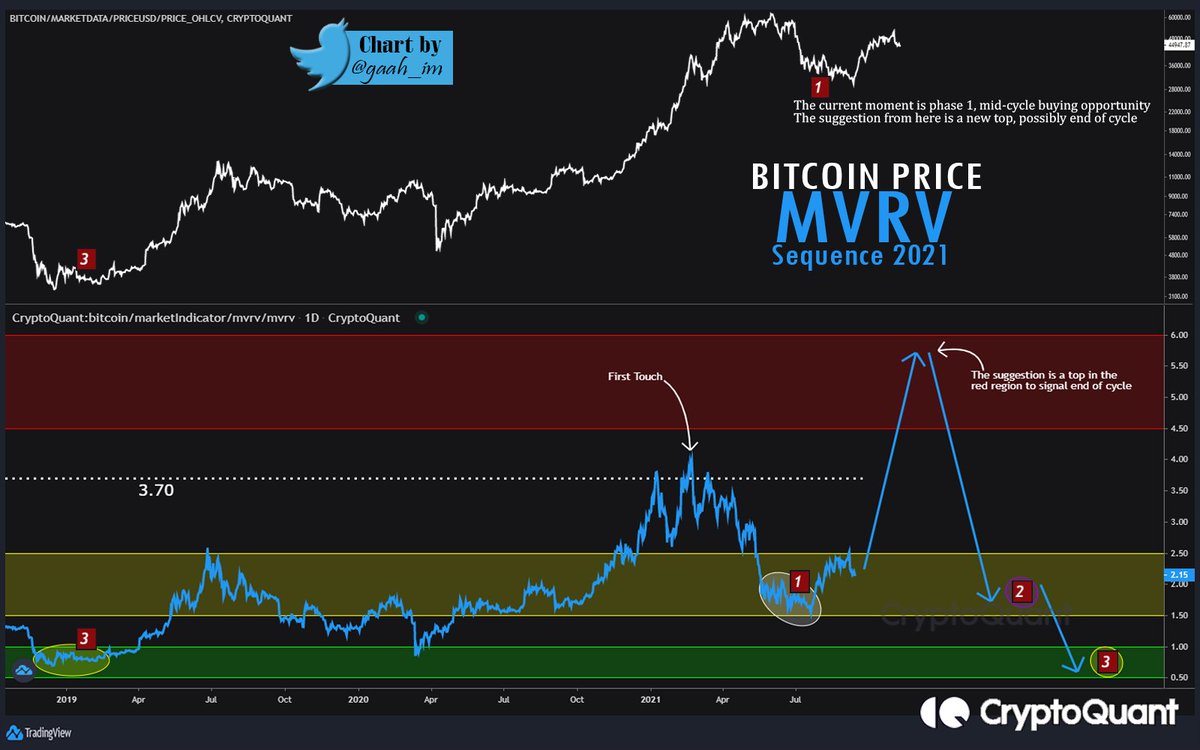
1. Ranking the phases of the cycles in sequence of 1-3 starting with NUMBER 1 after the start of the bull market and the top meeting in the middle of the bullish cycle.
2. There is a historical moment in the middle of the bull run, where it always looks like the end of the valuation, however it is just a short-term top in the middle of the bullish run. By hitting that top and offering the best buying moment within the bull market, 👇

that moment is defined as Sequence 1.
3. Sequence 2 will only occur after a top is made in the Red Region (4.5-6.0), historically in all previous bullish cycles this range marks the final top of the bullish cycle.
4. The "Bottom" is when Sequence 3 occurs, 👇
3. Sequence 2 will only occur after a top is made in the Red Region (4.5-6.0), historically in all previous bullish cycles this range marks the final top of the bullish cycle.
4. The "Bottom" is when Sequence 3 occurs, 👇
this moment happens only when #Bitcoin is in a cyclical bear market. It is only signaled for a brief moment and historically marked the bottoms of the bear market.
5. In 2011 there were 3 mid-cycle corrections, with 3 buying opportunities during the run. 👇
5. In 2011 there were 3 mid-cycle corrections, with 3 buying opportunities during the run. 👇

This moment is classified in sequence 1. High volatility caused all the tops to go beyond the Red Region.
6. 2013 was just a single correction in the middle of the bull run, approximately -75% deep. Practically a bear market in the middle of the bullish cycle. 👇
6. 2013 was just a single correction in the middle of the bull run, approximately -75% deep. Practically a bear market in the middle of the bullish cycle. 👇

It is 210 days sideways after the big dip and then recovers the last top.
7. Already in 2017, similar to 2011 in the aspect of corrections/tops, there are also 3 major retracements in the middle of the bull run, ending the bullish cycle only after touching the Red Region 👇
7. Already in 2017, similar to 2011 in the aspect of corrections/tops, there are also 3 major retracements in the middle of the bull run, ending the bullish cycle only after touching the Red Region 👇

at least once.
8. The 3.70 level in the MVRV indicator is the standard point of distortion between the two ratio metrics, in this case signaling near top. The same behavior in the current cycle can be seen in 2017, where the first touch higher before the end-of-cycle top👇
8. The 3.70 level in the MVRV indicator is the standard point of distortion between the two ratio metrics, in this case signaling near top. The same behavior in the current cycle can be seen in 2017, where the first touch higher before the end-of-cycle top👇
was exactly at the default level (3.70).
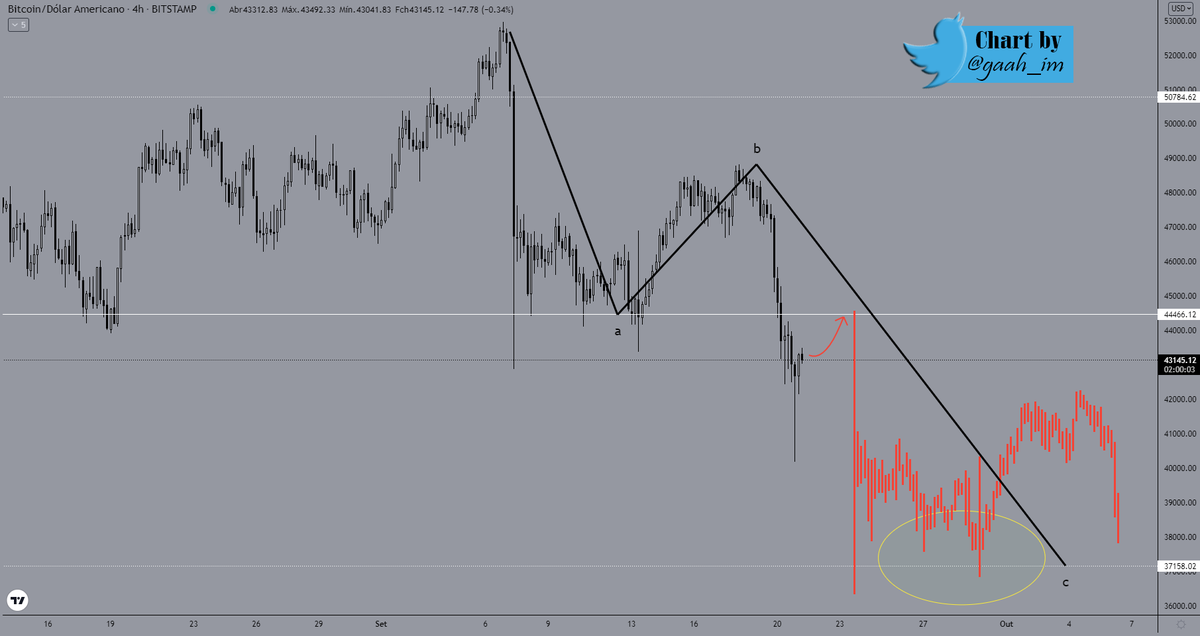
9. The high probability in question suggests a new ATH in prices, such as a new top in the Red Region in #MVRV. Sequence 1 is easily observed and only after a new top will we move on to sequence 2, as has been shown historically.
9. The high probability in question suggests a new ATH in prices, such as a new top in the Red Region in #MVRV. Sequence 1 is easily observed and only after a new top will we move on to sequence 2, as has been shown historically.
10. The current valuation cycle with respect to duration time is very similar to 2017, the previous bull runs (2011/2013) were faster compared to all cycles so far.
11. Excluding the time factor and taking into consideration only the behavior between the ranges, following the 2013 pattern it is still possible to see 2 new tops in the Region in Red. If this happens it will be altogether 3 major corrections in the current valuation cycle.

12. 2017 had the longest duration in the bull run period. Compared to the current cycle it is easy to observe sequence 1 and the next direction of price to continue for sequence 2.

13. You can use some data to determine the distribution of long-term holders within a bull market. According to @cryptoquant_com Analyst @DanielJoe916 the price rises as long term holders distribute. 👇
https://twitter.com/DanielJoe916/status/1440925378592206853?s=20
We are at the historical moment of re-accumulation, the next step is distribution following a parabolic move.
@DanielJoe makes the current moment clear through the behavior of Miners, they are important as they hold about 8.8% of the total #BTC supply.👇
@DanielJoe makes the current moment clear through the behavior of Miners, they are important as they hold about 8.8% of the total #BTC supply.👇
If Miners are accumulating and not selling strongly, it is not a bear market, but opportunity still within a bull market.👇
https://twitter.com/DanielJoe916/status/1440925437362794498?s=20
If you enjoyed the review please be sure to give it a like/RT, it helps a lot with engagement. Also, don't forget to follow me and follow @DanielJoe916 for further updates. Count on me! 🙌🤜🤛
Read quickly and directly from Quicktake:
cryptoquant.com/quicktake/614c…
Read quickly and directly from Quicktake:
cryptoquant.com/quicktake/614c…
• • •
Missing some Tweet in this thread? You can try to
force a refresh