It's over 3 weeks since schools reopened in England after summer - what's happening in the #COVID19 data?

I'll be honest with you, it's a mess

I've got no idea what's going on - the data is a bit baffling

Lets take a look... 🧵

1/
The headlines are mostly about PHE cases data

These have been increasing in most age groups since early August, with a slight flattening after reopening of schools, now rocketing in 10 - 15yo

Interestingly, sloping downwards in the <5s

Maybe a school effect on cases?

2/
We know the start of school based testing does botch the trends somewhat, which was always going to be difficult to disentangle

In contrast to case numbers, positivity is actually tanking, especially in people reporting symptoms

Increases in Rhinovirus etc boosting testing?

3/
More confusingly, the ONS paints a different picture again (although a week behind)

Rates didn't fall much in primary age children over summer at all, and are maybe up, or maybe flat?

Secondary school age dropped for summer and bumpy, but not going up since schools opened

4/
But the plot thickens further

Hospitalisations (which have been least labile to testing bias) *FELL* ~25% after schools opened (?recent uptick)

We don't have the disaggregation to see how this is influenced by the >15s rates dropping, but shouldn't be enough to explain it

5/
The concern has been from the increase in parent aged adults cases matching increases in those of school aged children, but increase office mixing and testing given circulating cold viruses could interfere?

The data is not conclusive

6/
So there you have it, clear as mud

We saw cases peaked very quickly in this age in Scotland, and with ~50% estimated to have already been infected, we may see the same in England

ONS will be interesting over the next few weeks

7/
BONUS TWEET

Great breakdown on this by @jburnmurdoch and @mroliverbarnes in @FT

“Case counts may be inflating the true level of infections among children in England”

ft.com/content/fbcd39…

• • •

Missing some Tweet in this thread? You can try to force a refresh
 

Keep Current with Alasdair Munro

Alasdair Munro Profile picture

Stay in touch and get notified when new unrolls are available from this author!

Read all threads

This Thread may be Removed Anytime!

PDF

Twitter may remove this content at anytime! Save it as PDF for later use!

Try unrolling a thread yourself!

how to unroll video
  1. Follow @ThreadReaderApp to mention us!

  2. From a Twitter thread mention us with a keyword "unroll"
@threadreaderapp unroll

Practice here first or read more on our help page!

More from @apsmunro

22 Sep
Proud our new analysis of the 2nd wave (mainly Alpha) of #COVID19 in children in the UK is now available!
Headlines:

- No evidence of increased severity
- Over 30% admissions <1y
- Over 40% admissions had comorbidities
- Over 20% incidental positives

assets.publishing.service.gov.uk/government/upl…

1/
Compared to wave 1, the acuity was lower - less unwell on admission, and less respiratory support

There were more admissions, likely representing a higher case count and lower threshold for admission

2/
Children with no comorbidity made up 60% of admissions, and of these >40% were <1yo, likely representing our lower threshold to admit infants

Indeed, children w/o comorbidities were less unwell and required much less support

3/
Read 7 tweets
16 Sep
The best data by far on #LongCovid is out from the ONS

For kids, the news is incredibly reassuring - parents minds should be put to rest

Rates of common symptoms after #COVID19 at 12 w for kids are extremely low (0% to 1.7%) compared to controls

ons.gov.uk/peoplepopulati…

1/
Previous ONS statistics have been widely misused, and difficult to interpret due to unavailable methods

This is all put to bed now. Excellent, transparent comparisons with a suitable control group.

Importantly, it includes COVID cases which would be missed by NHS testing

2/
One statistic stands out

At both 4 and 12 weeks, MORE children aged 2 - 11y in the control group were experiencing symptoms than in those who tested positive for #COVID19

3/
Read 9 tweets
14 Sep
Loads of people will now have heard of RSV for the first time

Here is a quick thread on the disease it causes (bronchiolitis) and why we DONT use salbutamol inhalers/nebulisers to treat it - they can even make it worse!

1/
Bronchiolitis does what is says on the tin

It’s infection with a virus (usually RSV, but can be others) affecting the small airways (“bronchioles”) causing inflammation (“itis”)

It causes wheezing, coughing, and difficulty breathing

2/
Usually it affects babies <1y of age (although in the US definitions are a bit different…) and is seasonal, coming in waves every winter

It is the most common cause of hospitalisation of children, usually for breathing support, extra oxygen, or help feeding

3/
Read 10 tweets
8 Sep
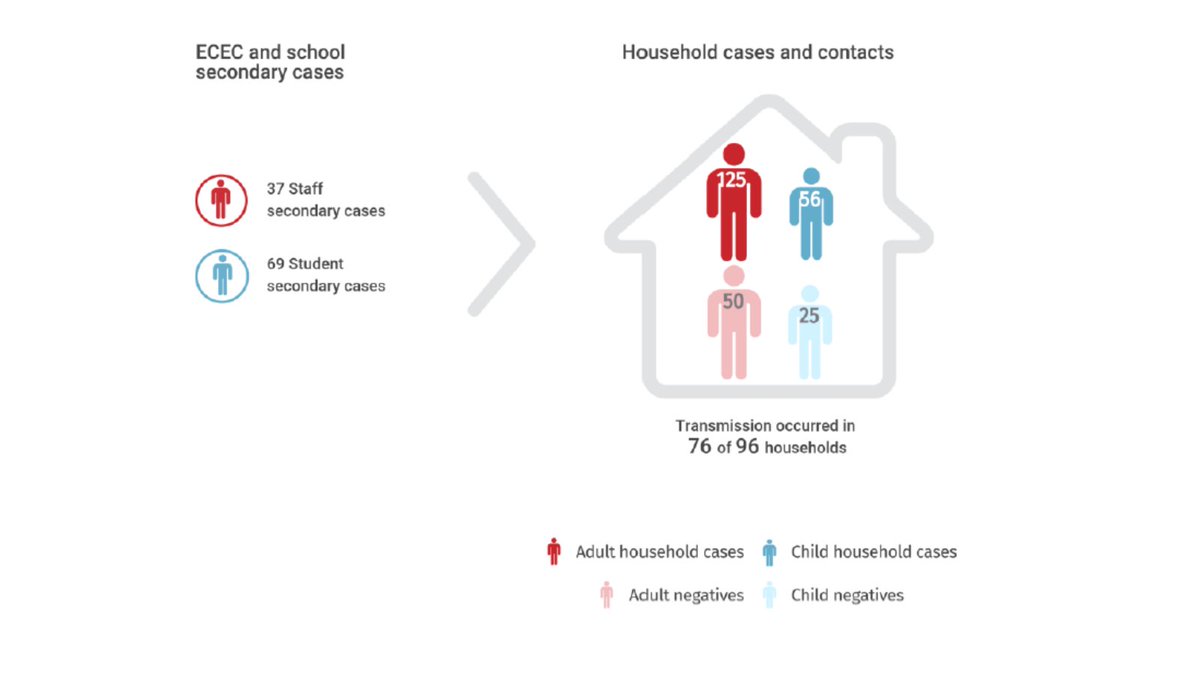
Amazing education settings outbreak data from the Delta #COVID19 outbreak in NSW 🇦🇺

Primary/Secondary schools mostly closed, so limited info to draw on (Attack rate v low, <2%)

BUT early years settings fully open with no masks!

What happened? 🧵

ncirs.org.au/covid-19-in-sc…

1/
There was secondary transmission in 16/32 settings

If the index was an adult, decent amounts of transmission - 17% AR to adults, only 8.1% to the kids

If the index was a child, minimal transmission - 1.3% to an adult, 1.8% to another child

Over 95% of contacts tested

2/
Once cases were back home, as you would expect with Delta, there was a lot of transmission

70% of all household contacts became infected

In 57% of households, everyone got infected (overdispersion in action)

3/
Read 6 tweets
6 Sep
Because England has excellent population data on #COVID19, we can make pretty accurate estimates of risk to children 🧵

Fortunately, these risks are extremely low

1/
Note when possible that we want to know rates *per infection*, not per positive test

This is because tests are contingent on how much you test, which is different across time and places

Risks per infection are much less changeable, and what we really care about

2/
Let's take the first 12 months of the pandemic up until Feb 28th 2021

Estimates based on seroprevalence are around 25% children <18 were infected by this point (16+ was >30%, younger will be a bit lower)

There are 12mil children in England, so this is 3mil infections

3/
Read 8 tweets
1 Sep
The worlds biggest study of post acute #COVID19 symptoms in children is out as a pre-print - the CLoCK study!

Fortunately results are very reassuring regarding symptom frequency and impact

Some important lessons, let's take a look 🧵

1/
bbc.co.uk/news/health-58…
The study compared people who tested positive for SARS-CoV-2 to those who tested negative

They looked at symptoms at the time of testing, and then 3 months later

The differences are then presumably due to one group having covid

They surveyed children aged 11 - 17

2/
What did they find?

At time of testing, 35% of test positives had symptoms compared to only 8% of test negatives

Astoundingly, 3 months later 67% of test positives had any symptoms, and *53% of test negatives* had symptoms

3/
Read 12 tweets

Did Thread Reader help you today?

Support us! We are indie developers!


This site is made by just two indie developers on a laptop doing marketing, support and development! Read more about the story.

Become a Premium Member ($3/month or $30/year) and get exclusive features!

Become Premium

Too expensive? Make a small donation by buying us coffee ($5) or help with server cost ($10)

Donate via Paypal Become our Patreon

Thank you for your support!

Follow Us on Twitter!

:(