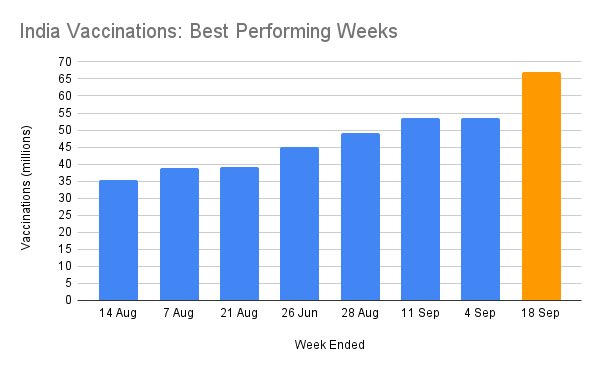
Updating for Oct 2nd week. It’s known that this is a slow week. How slow ? ‘Only’ 42.5 million, still among the top 8 weeks.
Various theories have been offered regarding this slowdown so we will look at some associated data.
1/
Various theories have been offered regarding this slowdown so we will look at some associated data.
1/
https://twitter.com/surajbrf/status/1444342166642315266

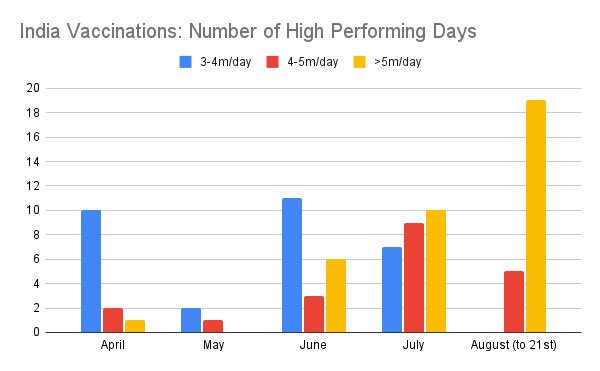
This week, the daily bucket chart also highlights weekday public holidays that affect footfalls:
Eid Jul 21
Janmashtami Aug 30
Ganesh Chaturthi Sep 10
Navratri Oct 7-15
Lesser/regional holidays have been skipped only due to lack of pan-India data impact.
2/
Eid Jul 21
Janmashtami Aug 30
Ganesh Chaturthi Sep 10
Navratri Oct 7-15
Lesser/regional holidays have been skipped only due to lack of pan-India data impact.
2/

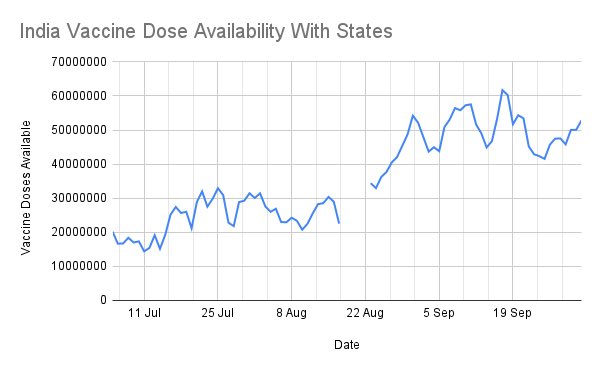
The vaccine availability chart shows anomalous behavior this month - rather than a seesaw between supply and use, it has risen until 10th.
Oct started with 50m doses, supply rose to 85m, while consumption was 42.5m -> 77.5m doses supplied, or likely ~265m for the month.
3/
Oct started with 50m doses, supply rose to 85m, while consumption was 42.5m -> 77.5m doses supplied, or likely ~265m for the month.
3/

In other words - supply on track, but a drop in daily numbers as the week-long holiday hit.
CoWin data shows the Govt tried - open vaccination centers rose from 65k on Tue to 90k Thu-Sat, and 50K+ on Sun.
This tactic does not appear to have worked well, however.
4/
CoWin data shows the Govt tried - open vaccination centers rose from 65k on Tue to 90k Thu-Sat, and 50K+ on Sun.
This tactic does not appear to have worked well, however.
4/
This suggests opening many centers doesn’t ensure enough people show up during an extended holiday - a vaccination drive is needed.
States that have been doing regular drives continue to do so, e.g. UP here (image credit: covid19india.org) is due for its next.
5/
States that have been doing regular drives continue to do so, e.g. UP here (image credit: covid19india.org) is due for its next.
5/

Perhaps a better tactic during an extended holiday is more closely spaced mass vaccination drives, since supply is no constraint. This also reduces the pressure on HCWs who otherwise man the greater number of centers each day despite fewer footfalls.
6/
6/
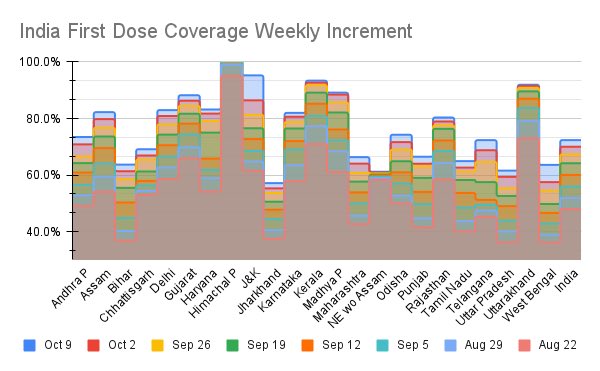
Now to address the question, has vaccination reached close to saturation, causing this slowdown ?
This graph shows how much the 1st dose coverage of eligible pop has risen each wk for the last 8 wks.
Hint: The white space on top is what is left to do of 1st doses.
7/
This graph shows how much the 1st dose coverage of eligible pop has risen each wk for the last 8 wks.
Hint: The white space on top is what is left to do of 1st doses.
7/
Similarly, the same data for second doses. The gap is large because Covishield (85% of total) has a 12-16 week interval and a lot of 1st doses happen in that time.
The west primarily uses a vaccine with 21 day interval so fully vaxed numbers will track closer.
8/
The west primarily uses a vaccine with 21 day interval so fully vaxed numbers will track closer.
8/

This chart shows how far each state is from the 2.0 mark signifying both doses done there, i.e total doses / 2*eligible pop.
Again there is a lot of white space on top, i.e. quite a bit of extra
9/
Again there is a lot of white space on top, i.e. quite a bit of extra
9/

By tracking weekly data in this manner, the goal is to see if first dose incremental number compress beyond some threshold , e.g. 75-80%, or whether they keep going the same at least during normal weeks. Correspondingly, 2nd dose increments should rise.
10/
10/
This week reads:
Sun: 2.9M
Mon: 7.6M
Tue 6.5M
Wed: 4.9M
Thu: 5.2M
Fri: 7.9M
Sat: 7.2M
And Oct 10 9(Sun) is ~4.6M according to CoWin.
There’s little evidence here of anything other than the biggest annual festival season affecting data, and immediate response by Govt.
11/11
Sun: 2.9M
Mon: 7.6M
Tue 6.5M
Wed: 4.9M
Thu: 5.2M
Fri: 7.9M
Sat: 7.2M
And Oct 10 9(Sun) is ~4.6M according to CoWin.
There’s little evidence here of anything other than the biggest annual festival season affecting data, and immediate response by Govt.
11/11
• • •
Missing some Tweet in this thread? You can try to
force a refresh