Suraj Profile picture
2 Oct, 11 tweets, 5 min read
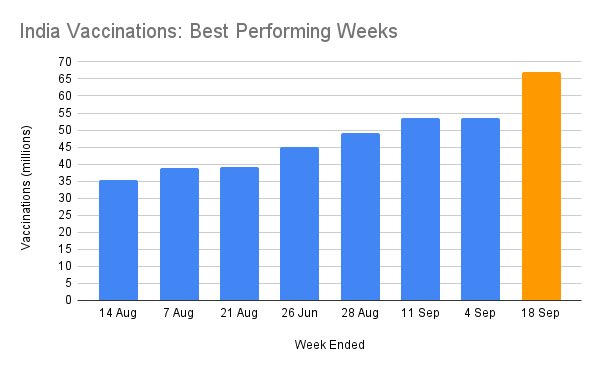
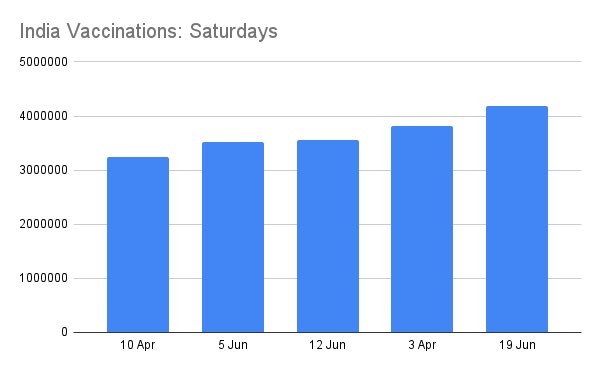
Updating for the start of October. The prior week had 49 million doses. A soft period coming on the back of successive weeks of high performance dominating the top 5 in this chart:

1/
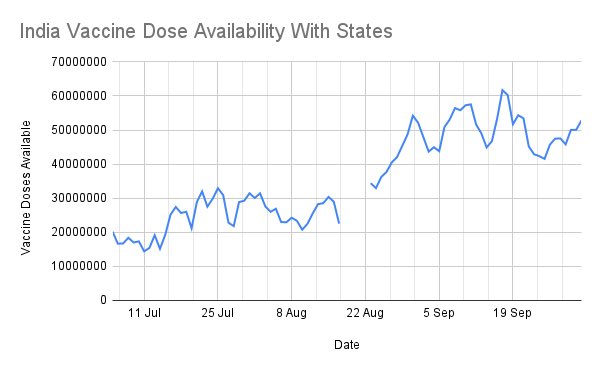
The primary reason for this is a softness in supply coming on the back of 4 long weeks of high performance. However this is now improving as the graph shows, with the available supply back over 50M :

2/
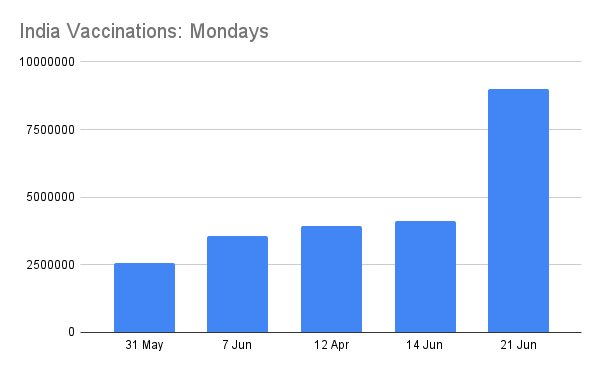
Weekly performance remained steady with no major movement. Trailing 7DMA is now a shade under 7M/day but should go up soon.

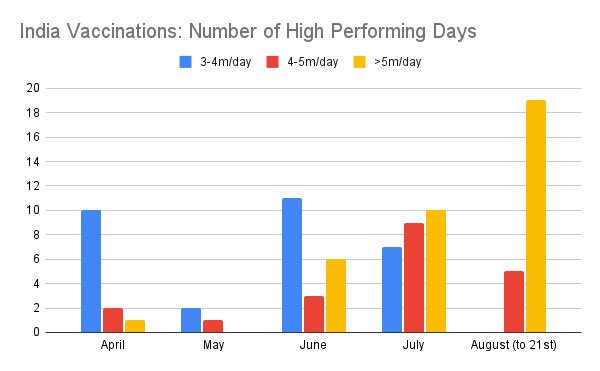
I may stop presenting this chart. Oct is likely to have many days over 10M, which this doesn’t show well. If you like this data, please say so.

3/
Now for the major highlights:

September ended with 239 million doses done, average 8M/day over 30 days. That is not far from double-vaxing the entire adult NZ or Singapore population every day for a month.

Cumulative total now 904 million as of Oct 2.

4/
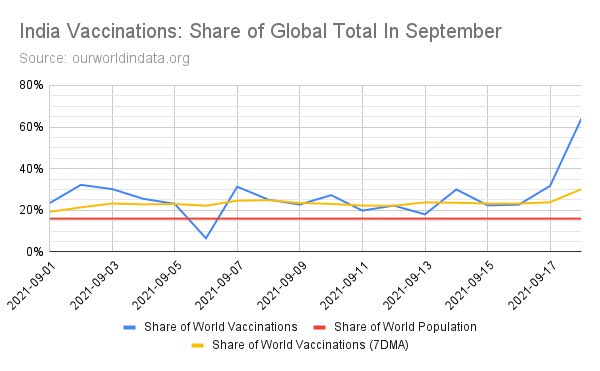
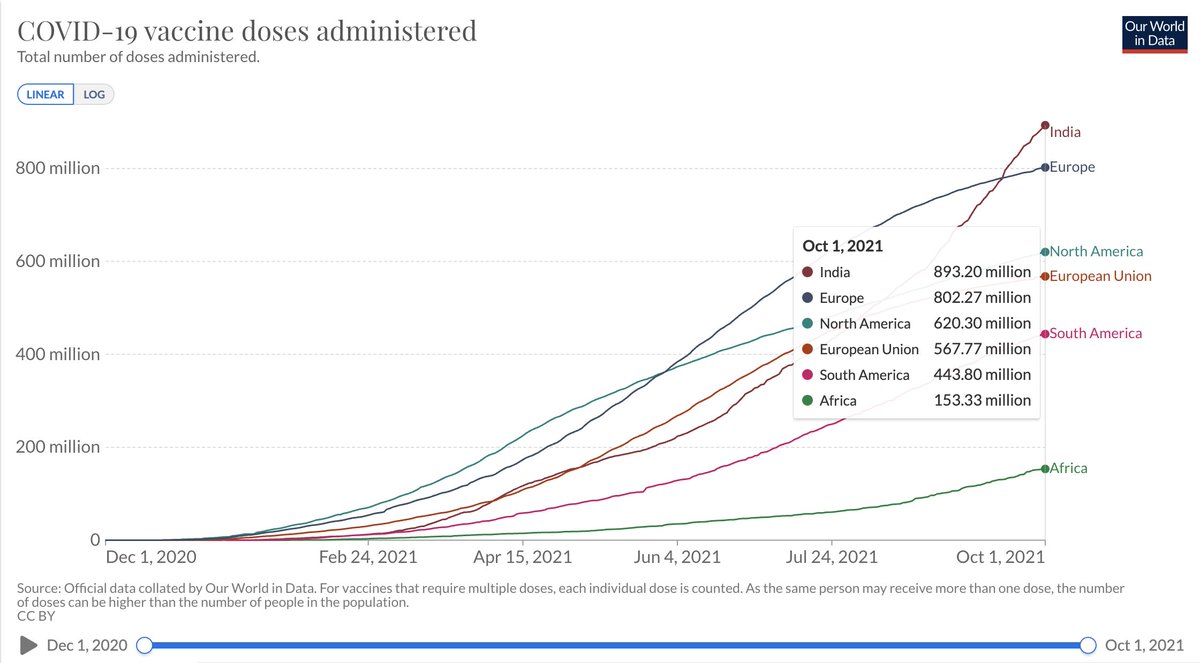
India accounted for 26.5% of global vaccinations in Sept. It ended the month exceeding the vaccinations in all of Europe, all of the Americas and Africa, COMBINED.

There’s no desire to gloat, but to show sense of proportion. Understanding & conclusions follow from that.

5/
The following two graphs show the landscape at the start and end of September. From ~80M behind, India is now ~100M ahead of continental Europe in vaccinations.

As stated before, ourworldindata has a 1-2 day data collection delay.

6/
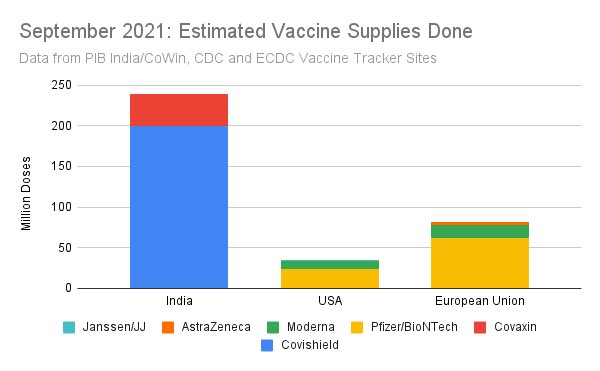
This also shows up in vaccination supply data. Cumulatively, US+EU output slightly exceeds India, but in September, they combine to barely half of India’s output:

7/
This is an unspoken problem. As the prior India vs other data shows, many are slowing down. It is unclear why. They are a long way from done. India is now projected to take less time than the west.

This is a simple projection, but the slowdown elsewhere is real.

8/
A great piece of news is ZyCov-D now becoming available in October. It is authorized for 12-17 children, which is critical for school opening:

9/

swarajyamag.com/insta/first-ba…
October is projected to have 270-280M dose projection of Covishield + Covaxin alone. ZyCov-D now adds to that. If BioE is authorized soon, thats adds more. The available supply at start of month is 51M.

The baseline availability is thus 320-330M, with upside.

10/
Since the daily CoWin tracker is now a pastime, for the cricket fans (@aparanjape ?), in September India did just over a Gavaskar - 239.

In October will we do a
Dravid (270) ?
Laxman (281) ?
Sehwag-lite (293) ?
Sehwag-first (309) ?
Sehwag-max (319) ?

🙂

11/11

• • •

Missing some Tweet in this thread? You can try to force a refresh
 

Keep Current with Suraj

Suraj Profile picture

Stay in touch and get notified when new unrolls are available from this author!

Read all threads

This Thread may be Removed Anytime!

PDF

Twitter may remove this content at anytime! Save it as PDF for later use!

Try unrolling a thread yourself!

how to unroll video
  1. Follow @ThreadReaderApp to mention us!

  2. From a Twitter thread mention us with a keyword "unroll"
@threadreaderapp unroll

Practice here first or read more on our help page!

More from @surajbrf

20 Sep
Updating for 3rd wk Sept. Slightly delayed due to delayed data update on PIB/MoHFW.

Predictably after the 25M world record on Sept 17, this week is the best ever- 67 million.

This week alone is 2x the total by Europe or North America for the whole September to date.

1/
The daily bucketed performance is unable to show the magnitude of the Sept 17th perf well enough. A simpler expression is:

1. On Sept 17, India did more doses than the rest of the world combined.
3. India accounted for ~60% of doses worldwide that day.

2/
The following two charts show Indian vaccination as a fraction of global total in September, both daily and aggregate.

India has outdone its share of world pop (~16%) substantially. When share crosses 50%, that means India outdoes rest of world combined.

3/
Read 10 tweets
4 Sep
Updating for 1st week of Sept, with the risk of sounding like a broken record:

* This week overtook last week as the best week ever.
* First ever instance of >50 million in a week, finishing with 53.6M

1/
Updating the bucket chart of daily number classification shows just how much the recent performance has accelerated, with multiple >10M days interspersed between >6M days.

All data is at intervals between PIB 7pm data.

2/
I’ve summarized the month of August itself separately and written an article about it:


Three months of successively outdoing projections culminated in a record 185m doses in August, vs 150m projected.

3/
Read 12 tweets
28 Aug
A very simple summary of August 4th week:

Best. Week. Ever.

49.2 million vaccinations between Aug 22-28.

1/ Image
It included the first instance of a day of >10 million vaccinations, in a week where the worst weekday was 5.6 million. This new chart reports daily number for the past 3 months broken into buckets:

2/ Image
This new chart was necessitated by the fact that every day is now over 5m. 4 weeks of August are:
19 days >5m
5 days of 4-5m
4 Sundays

The data above 5m is so frequent and varied that it does not work as a single bucket anymore.

3/ Image
Read 10 tweets
8 Aug
This thread overviews the extraordinary performance of @Neeraj_chopra1 at Tokyo 2020 in the men’s javelin throw event - the statistics & history involved.

It describes the pathbreaking nature of the achievement, with regard to both Neeraj’s own and continental performance.

1/
No Asian has ever won the men’s javelin gold before. The event has been the preserve of east/central Europeans built like tanks. Neeraj is only the second non-white to win it after Kershorn Walcott. In fact the magnitude of the achievement is even greater…

2/
No Asian has ever even medaled in Olympic javelin throw before. The Finns and other Nordics monopolize it, with Germany, USSR and Hungary making up most of the rest. They also own all the best javelin brands, covered later. But that’s not all…

3/
Read 15 tweets
26 Jun
Updating this for June Week 4.

The only way to describe this week is OFF THE CHARTS.

Forget all the encouraging steady rise numbers so far. This week blew them away, doubling the 7DMA in a week to begin with:

1/
Each of the last 8 days - from Sat Jun 19 to Sat Jun 26 - were all time best days of week for vaccinations, with 26th overtaking the perf on 18th. The past week dominates the list of best ever single days for vaccinations:

2/
June Week 4 was by a long distance the best ever week, with almost 45 million vaccinations done, exceeding the populations of many countries:

3/
Read 7 tweets
23 Jun
Well, let’s look at the best performing Sun, Mon and Tue for vaccination since start of April when >45 was allowed then.

Oops. The best ever Sunday was June 20. The best ever Monday was June 21. The best ever Tuesday was June 22.

1/
Maybe the ‘hoarding’ began Saturday then ? Oops no, Saturday June 19 was the best ever Saturday.

Must be Friday ? Nope, June 18 was the 4th best but very close to the top, and Fridays in June take up 3 of top 4.

2/
So did the trickery begin earlier ? Nope. Three full weeks of June occupy spots 2, 3 and 5 of top 5 best performing weeks along with the 2 April peak. Three days in , the current week is already on track to make the top 5 easily, if not become the all time best week.

3/
Read 6 tweets

Did Thread Reader help you today?

Support us! We are indie developers!


This site is made by just two indie developers on a laptop doing marketing, support and development! Read more about the story.

Become a Premium Member ($3/month or $30/year) and get exclusive features!

Become Premium

Too expensive? Make a small donation by buying us coffee ($5) or help with server cost ($10)

Donate via Paypal Become our Patreon

Thank you for your support!

Follow Us on Twitter!

:(