🧵Having previously tweeted on the post ejection LV velocities and the relation to aortic valve closure mechanics,
from findings in our recent paper
onlinelibrary.wiley.com/doi/epdf/10.11……
I will now take a look on the isovolumic relaxation.
https://twitter.com/strain_rate/status/1430824994569924613?s=20
from findings in our recent paper
onlinelibrary.wiley.com/doi/epdf/10.11……
I will now take a look on the isovolumic relaxation.
1/ In the paper pubmed.ncbi.nlm.nih.gov/34184410/ we found a consistent finding of isovolumic apical lengthening and basal shortening 

2/ This, of course, indicates a volume short, from base to apex, even if total volume is constant.

3/ The relaxation in the apex, is probably related to the apical "untwisting". The basal shortening is probably due to prolonged tension, interaction with the apical relaxation.
4/ This volume shift causes an apically directed intraventricular flow, as know for some time. pubmed.ncbi.nlm.nih.gov/3624661/

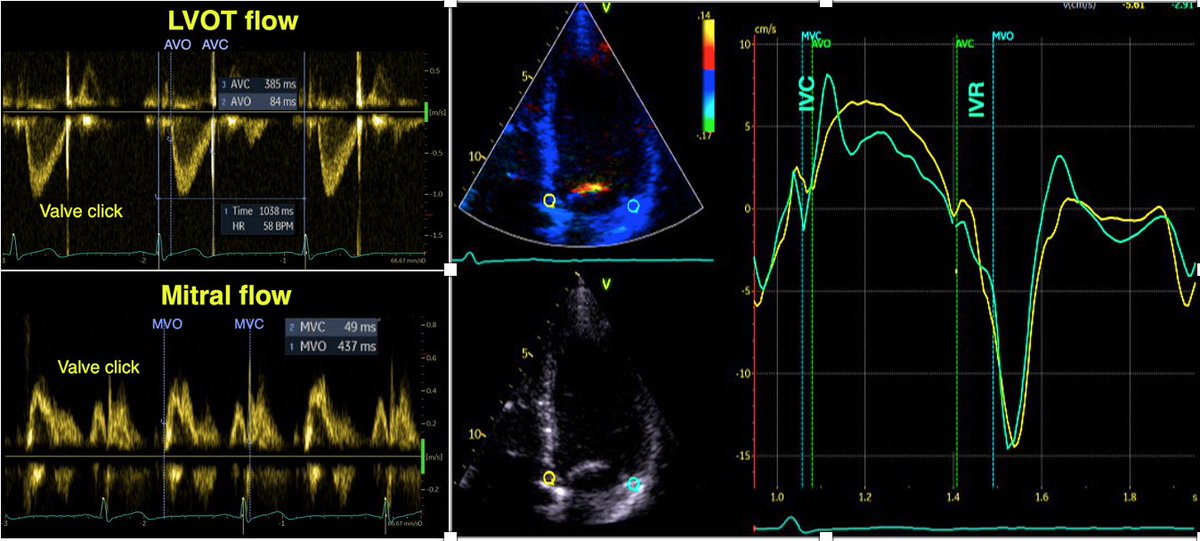
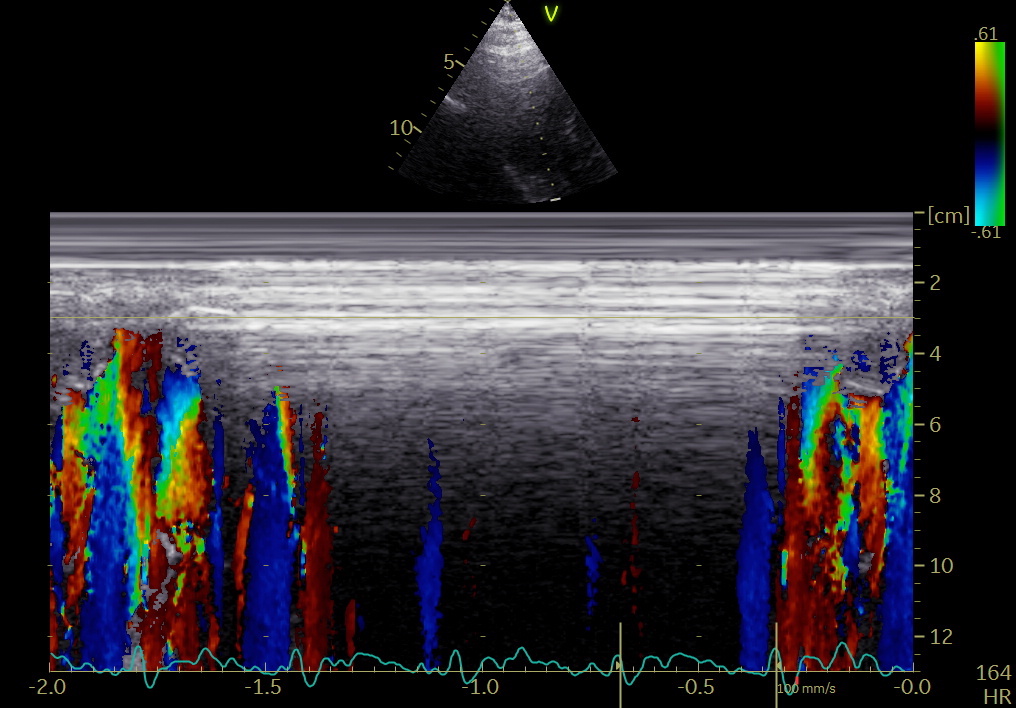
5/ This can now also be demonstrated, both with colour M-mode, showing consistent apical flow both we-tally and laterally during IVR, as well as flow vector imaging. pubmed.ncbi.nlm.nih.gov/34620522/

6/ This, of course, means that the intraventricular blood pool already has an apically directed momentum before MVO, adding to the momentum of early filling.

7/ which means that IVC contributes to the kinetic energy of filling, as shown by this diagram, there is kinetic energy already at the start of LV filling (E). Figure from pubmed.ncbi.nlm.nih.gov/34620522/ top row is kinetic energy, left one representative curve, right all study subjects

8/ And as the simultaneous shortening at the base and elongation of the apex has a clear physiological function, the notion that shortening during IVR is "wasted work" must be considered totally non-sensical.
9/ Vector flow imaging. Loop by Annichen S Daae.
unroll @threadreaderapp
• • •
Missing some Tweet in this thread? You can try to
force a refresh