📣 WEEKLY UPDATE: Has the COVID Red/Blue divide finally peaked??
acasignups.net/21/10/12/weekl…
Two weeks ago, the new COVID case rate since 6/30 in the reddest tenth of the population was running 3.06x higher than in the bluest tenth.

As of today that's dropped slightly, to exactly 3.0x higher: Image
What about the COVID *death* rate since 6/30? Two weeks ago that was running 5.5x higher in the reddest tenth than the bluest tenth.

Today that ratio has *increased* to 5.76x higher...

...however, deaths are a lagging indicator, so it's possible this, too, will start to shrink. Image
Both of these could be one-offs; it's entirely possible that one or both will continue to increase. However, this is the first time I've seen either ratio drop at all since the Delta wave started.

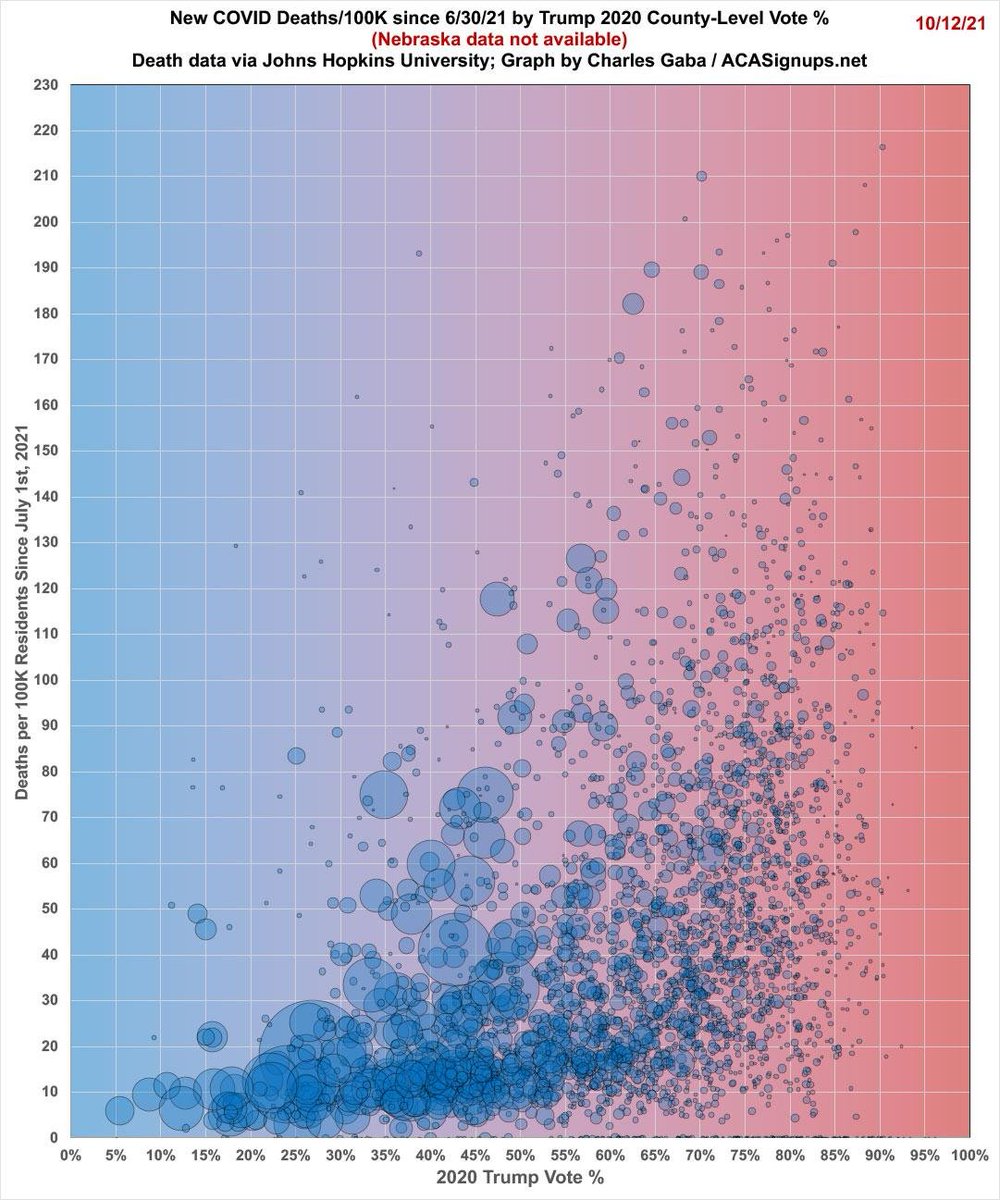
Meanwhile, here's the county-level death rates since 6/30 in scatter-plot format: Image
• • •

Missing some Tweet in this thread? You can try to force a refresh
 

Keep Current with Charles Ghoul-ba 👻

Charles Ghoul-ba 👻 Profile picture

Stay in touch and get notified when new unrolls are available from this author!

Read all threads

This Thread may be Removed Anytime!

PDF

Twitter may remove this content at anytime! Save it as PDF for later use!

Try unrolling a thread yourself!

how to unroll video
  1. Follow @ThreadReaderApp to mention us!

  2. From a Twitter thread mention us with a keyword "unroll"
@threadreaderapp unroll

Practice here first or read more on our help page!

More from @charles_gaba

13 Oct
Chilling: Mississippi is just 100 deaths away from COVID having killed 1 out of every 300 residents of the state.
Meanwhile, here’s where things stand nationally:
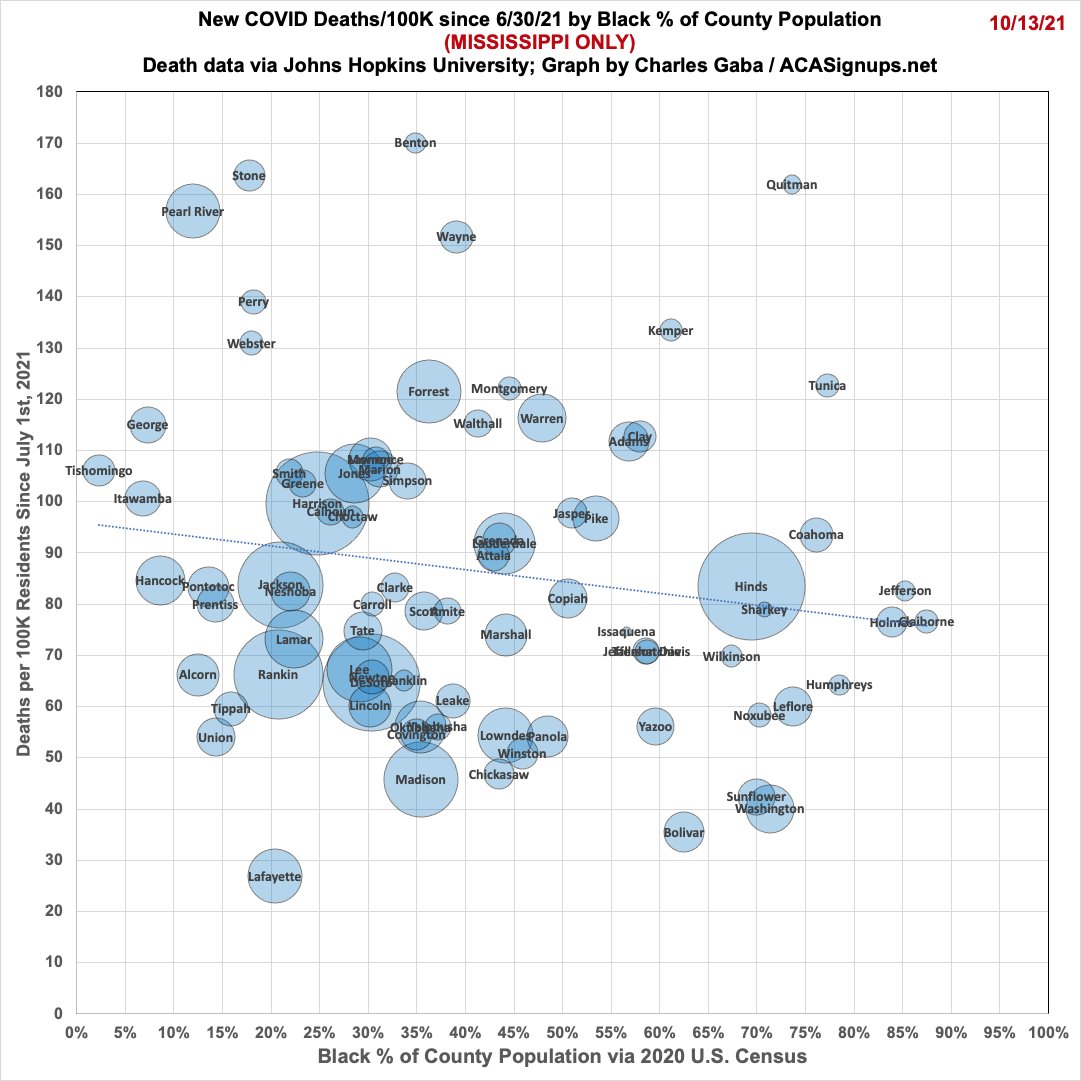
UPDATE: Re the racial factor: Here's the county-level COVID death rate since 6/30 for MS based on what % of the pop. is Black, according to the 2020 Census.

Note that this is based on what % of the *total* population is Black, not what % of deaths are among the Black population. Image
Read 6 tweets
13 Oct
📣 WEEKLY UPDATE: U.S. #COVID19 Vaccination levels by COUNTY & Partisan Lean:
acasignups.net/21/10/12/weekl…
Once Again: America in One Image: Image
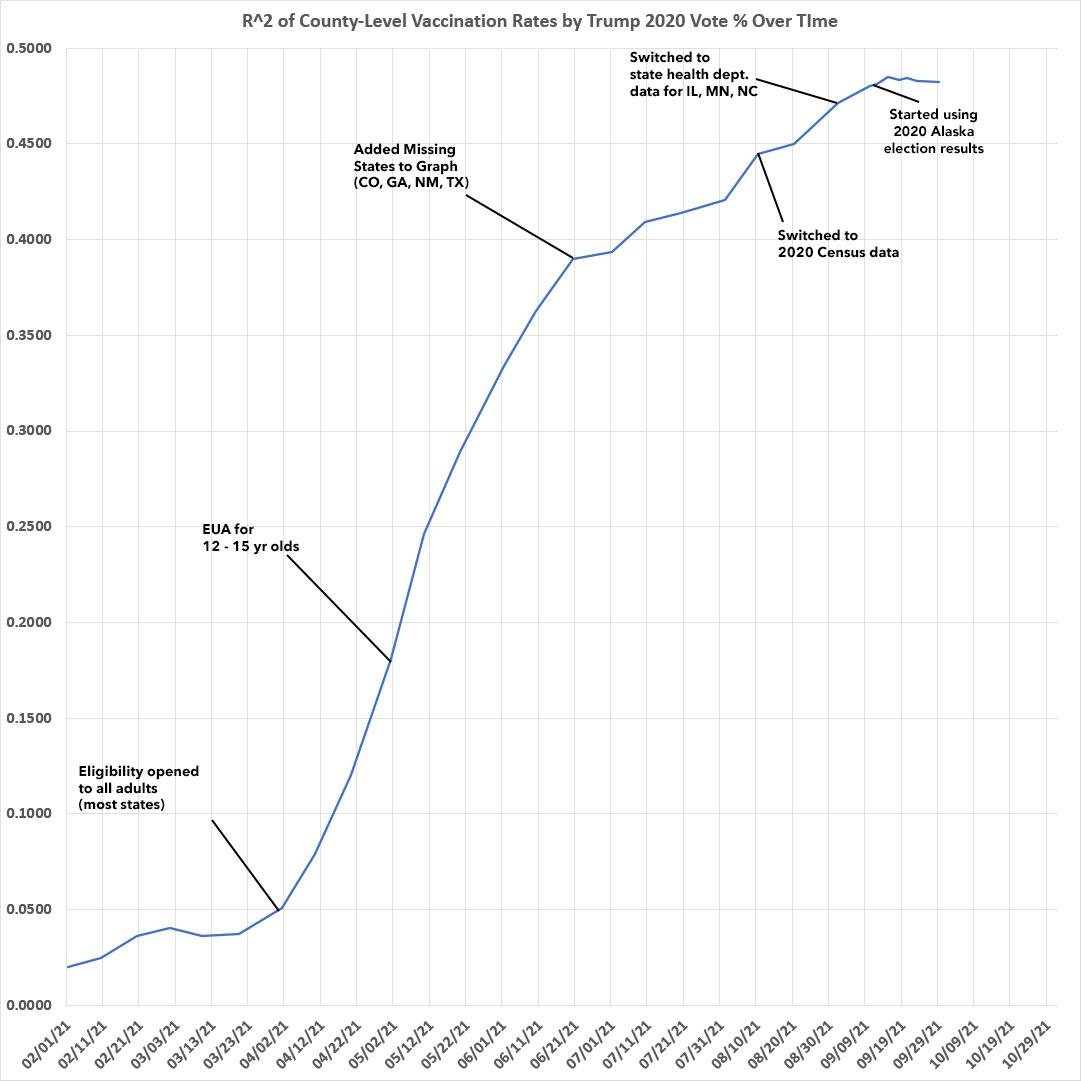
Having said that, it's worth noting that both the R2 and the Slope appear to have plateaued, and have even dropped slightly.

This was bound to start happening eventually as the most-vaxxed counties start bumping up against their thresholds (until 5-11 yr olds are eligible): ImageImage
Read 7 tweets
12 Oct
Could I also once again point out that Superman is literally a member of an alien species, which presumably means that human concepts of gender wouldn’t really apply anyway?
“Superman can’t be Black! That makes no sense!”
“Superman can’t be bisexual! That makes no sense!”
“Superman can’t cause time to reverse itself by flying around the Earth really fast and reversing its rotation! That makes no…oh, wait…”
Oh yeah: Superman can’t use a phone booth to change into his costume anymore either, since there’s no longer any phone booths. Thing change. You have to roll with it.
Read 4 tweets
5 Oct
📣 NEW: As promised, my own response to @ggreenwald & @JeremyBeckham regarding their criticism of @DLeonhardt's NY Times story and my own COVID red/blue divide analysis:
acasignups.net/21/10/05/rumor…
I really hope folks will actually read the full piece (there's over a dozen graphs & tables), but here's a couple of key ones.

First, here's the most recent breakout of COVID death rates since 6/30/21 by partisan lean. This is the graph which caused such a fuss in the 1st place:
8 days ago the death rate since June in the reddest 10th of the country was 5.5x higher than in the bluest 10th.

Today it's increased to 5.7x higher.
Read 6 tweets
2 Oct
Hey, look at that…I’m being attacked by Glenn Greenwald! I must’ve made the big time!
The author notes that Utah's COVID death rate ranks 45th nationally. That's true....since the beginning of the pandemic. However, my data specifically covers the period of the Delta variant, starting on July 1st, 2021...and Utah's death rate ranks 27th since then. 1/ Image
Re. the author's final claim--that if I had focused on UTAH at the county level, the NY Times wouldn't have been interested--he might want to rethink that.

(I had to modify the bar groupings because there's no way of breaking Utah into even 10ths at the county level) ImageImage
Read 17 tweets
27 Sep
📣 NEW: @DLeonhardt of the NY Times cited my work which concluded that the death rate in the highest Trump-voting counties is several times higher than in the lowest Trump counties.

I just posted a new analysis which brings this data up to date:
acasignups.net/21/09/27/time-…
According to the latest vaccination, case & death rate data from the CDC, state health depts & John Hopkins University tracker, as of yesterday... 2/
--The vaxx rate in the reddest tenth of the U.S. is currently 38% lower than in the bluest tenth.

--The COVID case rate since 6/30/21 in the reddest tenth is 3.1x higher than in the bluest tenth

--The COVID death rate since 6/30/21 in the reddest tenth is 5.5x higher.
Read 5 tweets

Did Thread Reader help you today?

Support us! We are indie developers!


This site is made by just two indie developers on a laptop doing marketing, support and development! Read more about the story.

Become a Premium Member ($3/month or $30/year) and get exclusive features!

Become Premium

Too expensive? Make a small donation by buying us coffee ($5) or help with server cost ($10)

Donate via Paypal Become our Patreon

Thank you for your support!

Follow Us on Twitter!

:(