Chilling: Mississippi is just 100 deaths away from COVID having killed 1 out of every 300 residents of the state.
Meanwhile, here’s where things stand nationally:
https://twitter.com/charles_gaba/status/1448047082670108672
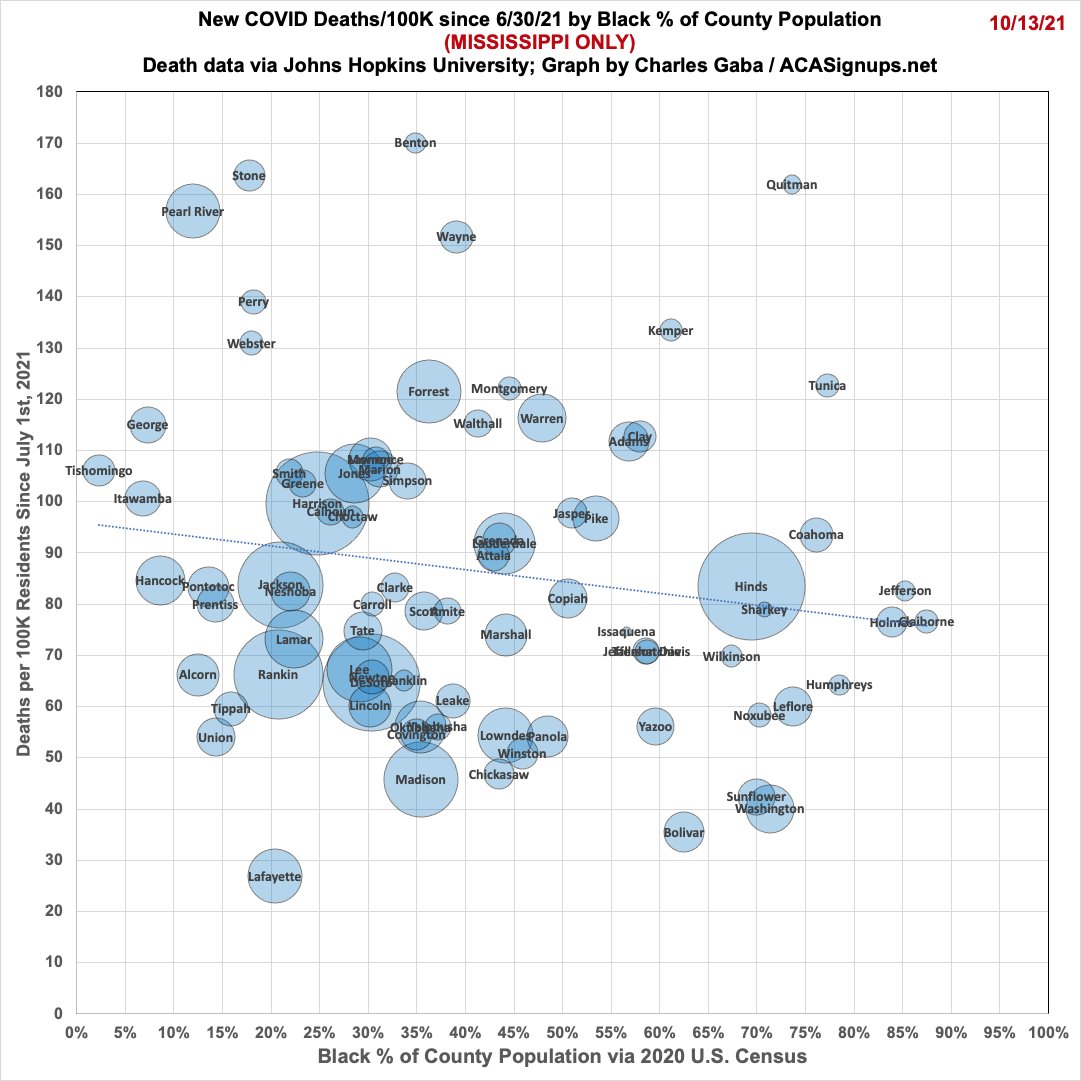
UPDATE: Re the racial factor: Here's the county-level COVID death rate since 6/30 for MS based on what % of the pop. is Black, according to the 2020 Census.
Note that this is based on what % of the *total* population is Black, not what % of deaths are among the Black population.
Note that this is based on what % of the *total* population is Black, not what % of deaths are among the Black population.

This is an important distinction.
Just as a county voting 80% for Trump doesn't necessarily mean that 80% of its COVID deaths are among Trump voters, a county being 80% Black doesn't necessarily mean 80% of its deaths are among Black folks.
Just as a county voting 80% for Trump doesn't necessarily mean that 80% of its COVID deaths are among Trump voters, a county being 80% Black doesn't necessarily mean 80% of its deaths are among Black folks.
Having said that, there doesn’t seem to be any particular connection between what % of the population is Black and how high the death rate is, at least since Delta hit the state.
UPDATE: OK, correction.
Via the 2020 U.S. Census, Mississippi had 2,961,953 residents in April 2020.
1 out of 300 would be 9,871 people.
Assuming @Worldometers is accurate, they've ALREADY broken that tragic milestone and are now at 1 out of 299.
Via the 2020 U.S. Census, Mississippi had 2,961,953 residents in April 2020.
1 out of 300 would be 9,871 people.
Assuming @Worldometers is accurate, they've ALREADY broken that tragic milestone and are now at 1 out of 299.

• • •
Missing some Tweet in this thread? You can try to
force a refresh


