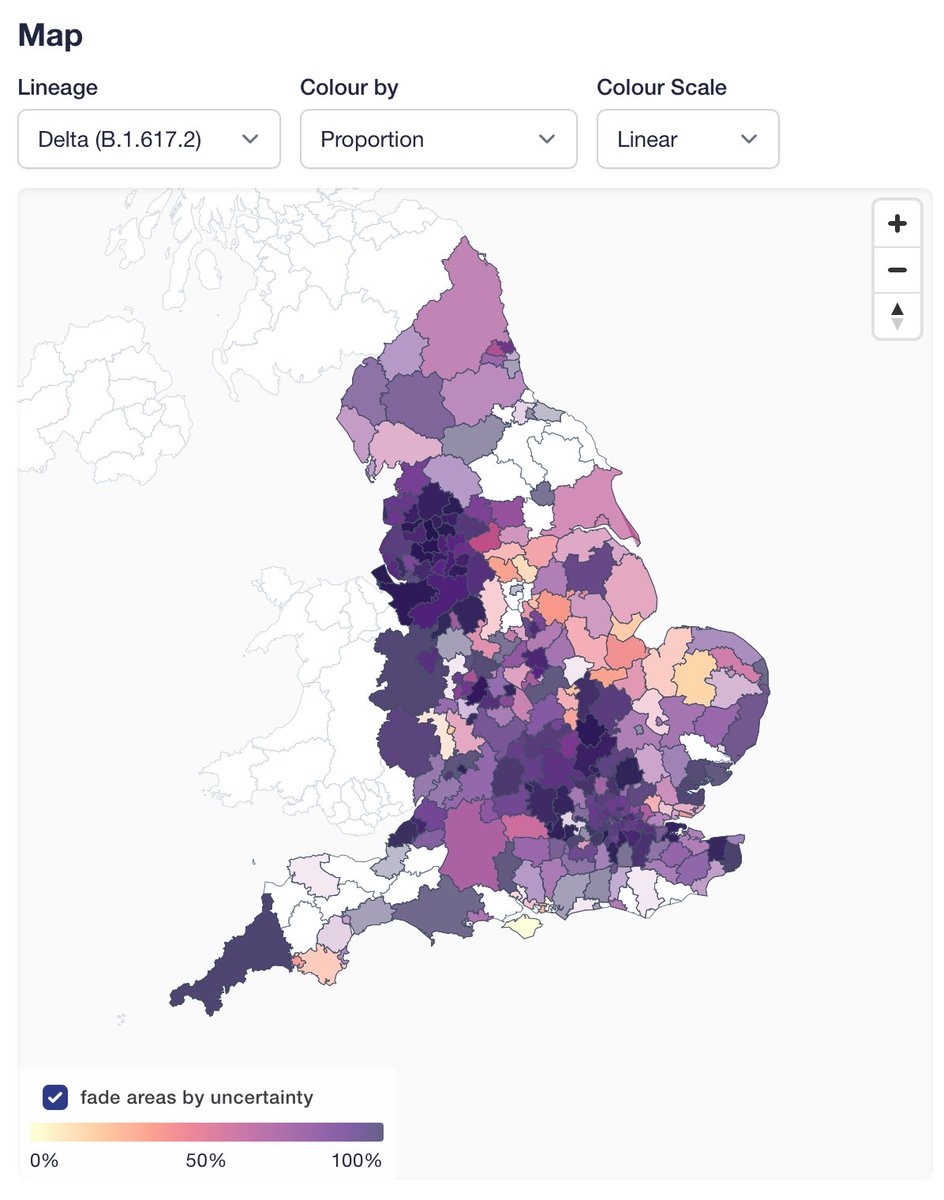
Proportion of AY.4.2 (now on covid19.sanger.ac.uk) has been steadily increasing in England, which is a pattern that is quite different from other AY lineages. Several of them rose when there was still Alpha to displace, but none has had a consistent advantage vs other Delta.
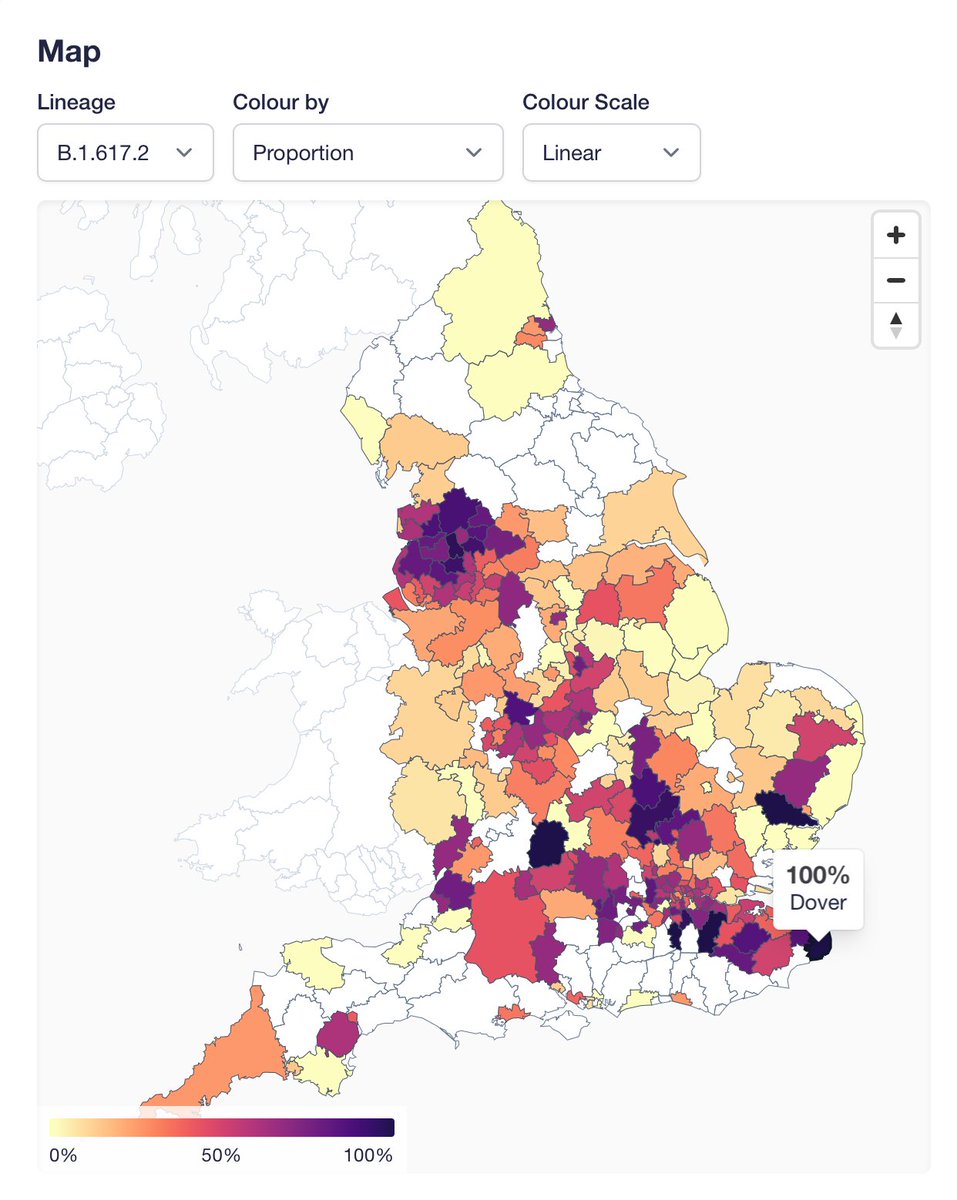
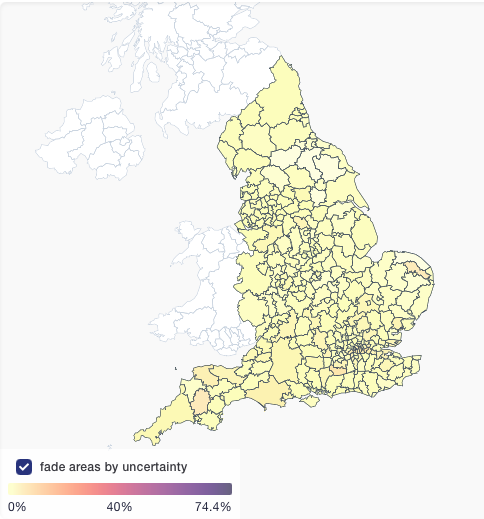
And it has grown all over the place between mid-July (L) and now (R). AY.4 did a similar thing, but it was not displacing other Delta, and given that it hasn't spread through the world, likely just had some epidemiological luck.
AY.4.2 hasn't yet spread much outside the UK, so could be a fluke (no biological advantage), but given that it's apparent advantage is modest, it needs to really get established somewhere to overcome stochasticity of small numbers.
That is, landing 20 Delta infections in a place with only Alpha almost guarantees that it will go on to complete replacement, whereas 20 AY.4.2 landing in an existing Delta epidemic may well fizzle.
10-15% increase in growth rate would be annoying but not catastrophic for the coming months. Likely the reason we're seeing this in the UK is a combination of high case rates (more mutations happening) and high sequencing rates (see changing patterns quickly).
What is perhaps more worrying is that it suggests the virus still has evolutionary paths to higher transmissibility open to it, and there are millions of Delta cases around the world without much sequencing coverage.

• • •

Missing some Tweet in this thread? You can try to force a refresh
 

Keep Current with Jeffrey Barrett

Jeffrey Barrett Profile picture

Stay in touch and get notified when new unrolls are available from this author!

Read all threads

This Thread may be Removed Anytime!

PDF

Twitter may remove this content at anytime! Save it as PDF for later use!

Try unrolling a thread yourself!

how to unroll video
  1. Follow @ThreadReaderApp to mention us!

  2. From a Twitter thread mention us with a keyword "unroll"
@threadreaderapp unroll

Practice here first or read more on our help page!

More from @jcbarret

18 Oct
Technical pre-print up from me and @theosanderson on why G142D is not the world's most recurrent mutation: medrxiv.org/content/10.110… A short 🧵 with highlights, and a tidbit about AY.4.2 to tempt you to read it.
People have noticed that S:G142D seems to appear and disappear on the Delta tree in a very weird fashion. @babarlelephant noted early on that this is due to an issue with the @NetworkArtic V3 primers, one of which is hit by a 6bp deletion in all Delta
In our paper we confirm that if you look not for presence/absence of 142D (e.g. by looking at text strings of mutations in GISAID), but at the actual sequence, all Delta is either D or N (missing data). Image
Read 8 tweets
19 Aug
Should I be worried about AY.3?

TLDR: No.

Longer answer about this lineage, the challenges of cataloguing the current diversity of #SARSCoV2, the miracle of global open science, and handy questions to ask yourself when you see a new variant report follows in a 🧵.
First off, summary and background on AY.3 and its cousins here:
AY.3 was designated by @PangoNetwork because it was growing in parts of the USA, apparently from a single (or small number of) introductions. This is done NOT because it is necessarily biologically more transmissible but to make it easier to refer to. github.com/cov-lineages/p…
Read 11 tweets
18 Aug
Paper on within-host diversity (credits in Gerry’s tweet) is from the first wave of the pandemic, but the conclusions are timely, as the world wonders how the virus evolved and will evolve. In particular, I think the mutation spectrum is relevant to some interesting questions 🧵
This figure shows relative mutation rate: each colour is a type of mutation like C to A, with the bars showing the context of the bases to the left and right; below the line is the reverse complement (e.g. G to T for blue).Red C>U (C>T in DNA) mutations are by far the most common
In the very early history of the virus in humans it split into the A and B lineages, which (figure from zenodo.org/record/5075888…) differ from each other at two positions, in each case one is C and the other is T. If you just look at these two positions, lineage A is TC and B is CT
Read 6 tweets
14 Jun
Monday always means new data at covid19.sanger.ac.uk, but this week also brings new features! Overall picture should come as no surprise: Delta variant growing in proportion and absolute numbers. In fact, next week is likely to be our highest ever count of one lineage🧵
First new feature is "fade areas by uncertainty", or "nebulosity view", as I like to call it. We fade the colouring of local authorities on proportion view to give a visual hint that you shouldn't over-interpret an area with 100% Delta if it only has a handful of sequences.
Related to this, we show confidence intervals on proportion tooltips and in the unstacked version of the proportion graph. Compare the following two local authorities with similar point estimates, but different amounts of data.
Read 5 tweets
8 Jun
The description of genomic analyses in this piece about the spread of the Delta variant in the UK has major inaccuracies, and hindsight bias. 🧵
theguardian.com/commentisfree/…
Early on, the author, @chrischirp, notes that Pakistan and Bangladesh were red-listed on 9 April, but India wasn't until 23 April. There is a reasonable criticism to be made here, but it has nothing to do with variants. Cases and % positivity were already on the rise in India
We know now that delay led to hundreds of importations of the Delta variant. The article says India "first reported a concerning new variant on 24 March...so why didn’t PHE immediately escalate Delta to a variant of concern in March?"
Read 11 tweets
31 May
We've pushed the weekly numbers update (thanks @theosanderson!) at covid19.sanger.ac.uk. As expected, in the most recent 2 week window, B.1.617.2 is the most common lineage in England. Still driven by local concentrations of high case numbers (L cases, R B.1.617.2):
A couple of notes on the site. We have updated the text describing ascertainment: we are no longer excluding surge tests, which make up a large fraction of all tests in key areas in recent weeks. I think this provides least biased frequencies now. Feedback welcome.
I've mentioned this before, but please be cautious interpreting proportions where we have few genomes. For example the "100%" in Dover doesn't mean much because it based on 3 genomes in the most recent 2 weeks of data:
Read 4 tweets

Did Thread Reader help you today?

Support us! We are indie developers!


This site is made by just two indie developers on a laptop doing marketing, support and development! Read more about the story.

Become a Premium Member ($3/month or $30/year) and get exclusive features!

Become Premium

Too expensive? Make a small donation by buying us coffee ($5) or help with server cost ($10)

Donate via Paypal Become our Patreon

Thank you for your support!

Follow Us on Twitter!

:(